Human PD-1 Antibody
R&D Systems, part of Bio-Techne | Catalog # MAB1086

Key Product Details
Validated by
Species Reactivity
Validated:
Cited:
Applications
Validated:
Cited:
Label
Antibody Source
Product Specifications
Immunogen
Leu25-Gln167
Accession # Q8IX89
Specificity
Clonality
Host
Isotype
Scientific Data Images for Human PD-1 Antibody
Detection of Human PD‑1 by Western Blot.
Western blot shows lysates of human peripheral blood mononuclear cells (PBMC) untreated (-) or treated (+) with 1 µg/mL PHA for 5 days. PVDF Membrane was probed with 1 µg/mL of Human PD-1 Monoclonal Antibody (Catalog # MAB1086) followed by HRP-conjugated Anti-Mouse IgG Secondary Antibody (Catalog # HAF007). A specific band was detected for PD-1 at approximately 33 kDa (as indicated). This experiment was conducted under reducing conditions and using Immunoblot Buffer Group 1.Detection of Human PD-1 by Immunohistochemistry
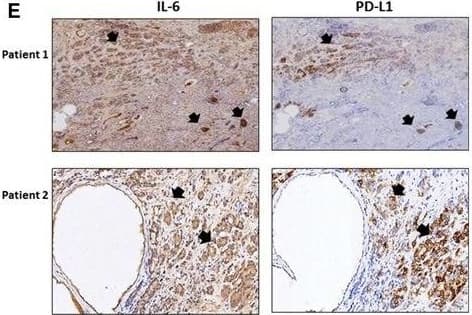
The role of IL‐6 signaling in the upregulation of PD‐L1 and downregulation of NKG2D ligands in CRPC cells. (A) PD‐L1 level in C4‐2siIL‐6/sc and CWRsiIL‐6/sc cell lines (left panel, mRNA level; right panel, protein level). (B) PD‐L1 IHC staining of tumor tissues. Error bars and significance values were obtained by counting positively stained cells in one randomly chosen phase of slides of three different stains. Magnification, 20× (inlet, 100×). (C) Blocking of IL‐6 Ab by neutralizing Ab of IL‐6 and the effect on PD‐L1 level in C4‐2sc and CWRsc cells. Cells were treated with either IL‐6 Ab or control IgG, total RNA extracted, cDNA converted, and the expression of PD‐L1 was compared in qPCR analyses. (D) PD‐L1 level in parental C4‐2 and CWR22Rv1 cells upon the addition of rhIL‐6. Parental cells (C4‐2P and CWR22Rv1P) were treated with rhIL‐6 (20 ng·mL−1) and PD‐L1 mRNA level was analyzed. (E) IHC staining of CRPC patient tumor samples. Two sets of adjacent tumor tissues (both samples, CRPC stage, Gleason score 8, patient age 70, Ningbo hospital in China) were stained with IL‐6 and PD‐L1. Arrows indicate the area showing positive staining of two molecules. (F) NKG2D ligand levels in IL‐6‐expressing cells and in IL‐6‐knockdown cells. Levels of five NKG2D ligands in C4‐2siIL‐6/sc and CWRsiIL‐6/sc cells were analyzed in qPCR analyses. (G) NKG2D ligand levels in parental C4‐2 and CWR22Rv1 cells upon the addition of rhIL‐6. Parental cells (C4‐2P and CWR22Rv1P) were treated with rhIL‐6 (20 ng·mL−1) and the NKG2D ligand levels (mRNA) were analyzed. (H) Flow cytometric analyses of NKG2D and PD‐1 on NK cells. Left two panels, primary NK cells were stained with PE‐NKG2D or APC‐PD‐1 and positive staining was analyzed. Right two panels, flow cytometric analyses of PD‐1 on NK cells, after coculture with tumor cells (6 h of incubation). Primary NK cells were added into tumor cells (1 : 1 ratio, tumor cells/NK cells) and collected after 6 h of incubation. PD‐1 levels in the collected NK cells were analyzed in flow cytometric analysis (using APC‐PD‐1 Ab). *P < 0.05, **P < 0.01, ***P < 0.001. Image collected and cropped by CiteAb from the following publication (https://pubmed.ncbi.nlm.nih.gov/28865178), licensed under a CC-BY license. Not internally tested by R&D Systems.Detection of Human PD-1 by Western Blot
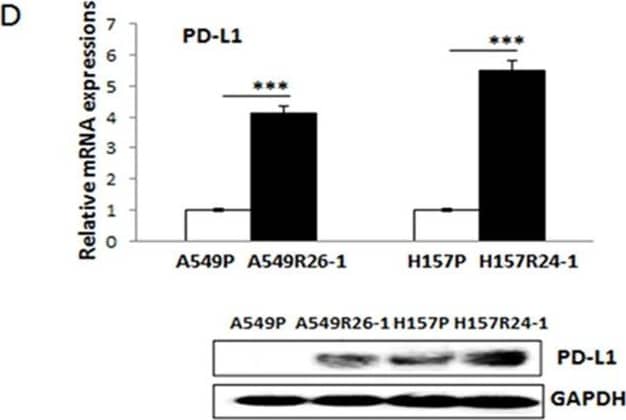
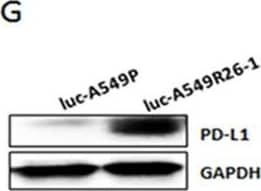
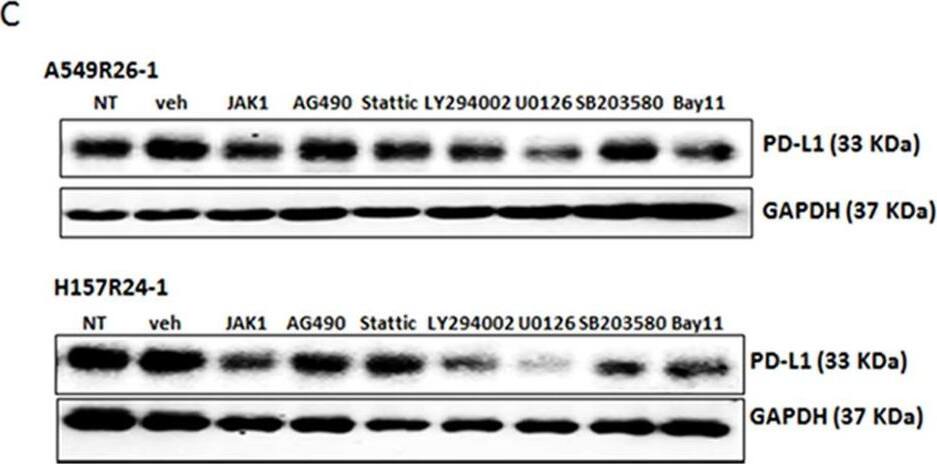
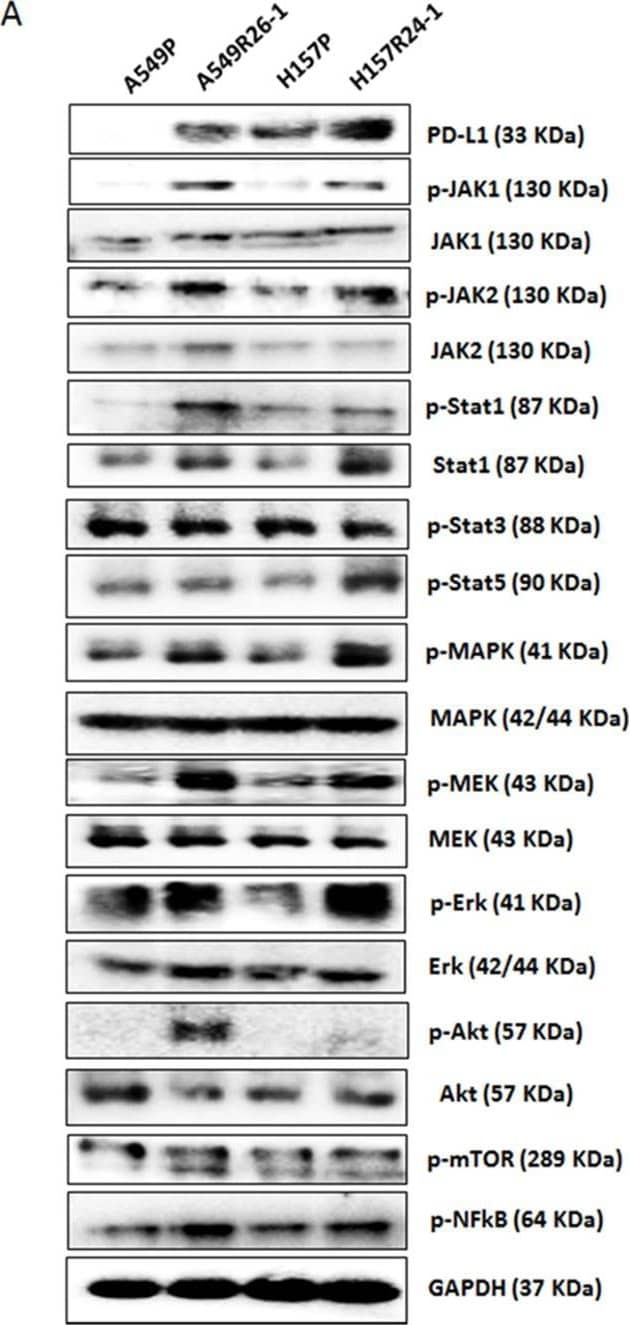
PD-L1/NKG2D ligand levels in radioresistant NSCLC sub-line cells and radioresistant cell-derived tumors (compared to parental cells and parental cell-derived tumors)(A) An illustration of radioresistant sub-line development procedure. (B) Clonogenic assay showing radioresistance of A549R26-1 and H157R24-1 sublines vs. respective parental cells. 100 to 1,000 cells (A549P/A549R26-1 and H157P/H157R24-1) were plated and cell survivals after different doses of radiation treatment were analyzed in clonogenic assay. (C) gammaH2AX IF staining. The numbers of gammaH2AX foci (A549P/A549R26-1 and H157P/H157R24-1) at different time points after radiation (6 Gy) were analyzed. (D) PD-L1 expression in parental and radioresistant cells (upper panel, qPCR data; lower panel, Western blot data). (E) Flow cytometry results analyzing surface PD-L1 levels in parental (red) and radioresistant (blue) cells. (F) Expression of NKG2D ligands (mRNA) in parental vs. radioresistant cells. (G) Western blot analysis results showing the PD-L1 levels in injected luc-549R26-1 and luc-A549P cells. (H) Mice studies testing radioresistance. Tumor regression differences at each time point in A549P-xenografts vs. A549R26-1 xenografts, with or without radiation treatments (5 Gy × 5 days) is shown. Y-axis represents fold of tumor growth based on luminescence measurement. (I) IHC staining of PD-L1 in tumor tissues obtained from A549P cells-derived and A549R26-1 cells-derived xenografts. *p < 0.05, **p < 0.01, ***p < 0.001 Image collected and cropped by CiteAb from the following publication (https://www.oncotarget.com/lookup/doi/10.18632/oncotarget.19193), licensed under a CC-BY license. Not internally tested by R&D Systems.Applications for Human PD-1 Antibody
Western Blot
Sample: Human peripheral blood mononuclear cells (PBMC) treated with PHA
Reviewed Applications
Read 2 reviews rated 4 using MAB1086 in the following applications:
Formulation, Preparation, and Storage
Purification
Reconstitution
Formulation
Shipping
Stability & Storage
- 12 months from date of receipt, -20 to -70 °C as supplied.
- 1 month, 2 to 8 °C under sterile conditions after reconstitution.
- 6 months, -20 to -70 °C under sterile conditions after reconstitution.
Background: PD-1
Programmed Death-1 (PD-1) is a type I transmembrane protein belonging to the CD28/CTLA-4 family of immunoreceptors that mediate signals for regulating immune responses (1). Members of the CD28/CTLA-4 family have been shown to either promote T cell activation (CD28 and ICOS) or downregulate T cell activation (CTLA-4 and PD-1) (2). PD-1 is expressed on activated T cells, B cells, myeloid cells, and on a subset of thymocytes. In vitro, ligation of PD-1 inhibits TCR-mediated T cell proliferation and production of IL-1, IL-4, IL-10, and IFN-gamma. In addition, PD-1 ligation also inhibits BCR mediated signaling. PD-1 deficient mice have a defect in peripheral tolerance and spontaneously develop autoimmune diseases (2, 3). Two B7 family proteins, PD-L1 (also called B7-H1) and PD-L2 (also known as B7-DC), have been identified as PD-1 ligands. Unlike other B7 family proteins, both PD‑L1 and PD‑L2 are expressed in a wide variety of normal tissues including heart, placenta, and activated spleens (4). The wide expression of PD-L1 and PD-L2 and the inhibitor effects on PD-1 ligation indicate that PD-1 might be involved in the regulation of peripheral tolerance and may help prevent autoimmune diseases (2). The human PD-1 gene encodes a 288 amino acid (aa) protein with a putative 20 aa signal peptide, a 148 aa extracellular region with one immunoglobulin-like V‑type domain, a 24 aa transmembrane domain, and a 95 aa cytoplasmic region. The cytoplasmic tail contains two tyrosine residues that form the immunoreceptor tyrosine-based inhibitory motif (ITIM) and immunoreceptor tyrosine-based switch motif (ITSM) that are important in mediating PD-1 signaling. Mouse and human PD-1 share approximately 60% aa sequence identity (4).
References
- Ishida, Y. et al. (1992) EMBO J. 11:3887.
- Nishimura, H. and T. Honjo (2001) Trends in Immunol. 22:265.
- Latchman, Y. et al. (2001) Nature Immun. 2:261.
- Carreno, B.M. and M. Collins (2002) Annu. Rev. Immunol. 20:29.
Long Name
Alternate Names
Entrez Gene IDs
Gene Symbol
UniProt
Additional PD-1 Products
Product Documents for Human PD-1 Antibody
Product Specific Notices for Human PD-1 Antibody
For research use only
