SOX17 in Human BG01V Cells.
SOX17 was detected in immersion fixed endoderm differentiated BG01V human embryonic stem cells using 10 µg/mL Goat Anti-Human SOX17 Antigen Affinity-purified Polyclonal Antibody (Catalog # AF1924) for 3 hours at room temperature. Cells were stained with the NorthernLights™ 557-conjugated Anti-Goat IgG Secondary Antibody (red, upper panel;
NL001) and counterstained with DAPI (blue, lower panel). View our protocol for Fluorescent ICC Staining of Cells on Coverslips.
Detection of Human SOX17 by Simple WesternTM.
Simple Western lane view shows lysates of BG01V human embryonic stem cells untreated (-) or endoderm differentiated (+), loaded at 0.2 mg/mL. A specific band was detected for SOX17 at approximately 59 kDa (as indicated) using 10 µg/mL of Goat Anti-Human SOX17 Antigen Affinity-purified Polyclonal Antibody (Catalog # AF1924) followed by 1:50 dilution of HRP-conjugated Anti-Goat IgG Secondary Antibody (Catalog #
HAF109). This experiment was conducted under reducing conditions and using the 12-230 kDa separation system.
Detection of Human SOX17 by Simple WesternTM.
Simple Western lane view shows lysates of iBJ6 human induced pluripotent stem cell line untreated (-) or endoderm differentiated (+), loaded at 0.2 mg/mL. A specific band was detected for SOX17 at approximately 58 kDa (as indicated) using 10 µg/mL of Goat Anti-Human SOX17 Antigen Affinity-purified Polyclonal Antibody (Catalog # AF1924) followed by 1:50 dilution of HRP-conjugated Anti-Goat IgG Secondary Antibody (Catalog #
HAF109). This experiment was conducted under reducing conditions and using the 12-230 kDa separation system.
Detection of Human SOX17 by Western Blot.
Western blot shows lysates of SK-OV-3 human ovarian adenocarcinoma cell line, OVCAR-3 human ovarian carcinoma cell line. PVDF membrane was probed with 2 µg/mL of Goat Anti-Human SOX17 Antigen Affinity-purified Polyclonal Antibody (Catalog # AF1924) followed by HRP-conjugated Anti-Goat IgG Secondary Antibody (Catalog #
HAF017). A specific band was detected for SOX17 at approximately 60 kDa (as indicated). This experiment was conducted under reducing conditions and using Western Blot Buffer Group 1.
Detection of Human SOX17 by Immunocytochemistry/Immunofluorescence.
Generation and characterization of systemic lupus erythematosus (SLE)‐specific human‐induced pluripotent stem cells (hiPSCs). Immunostaining of Otx2 (ectoderm marker), Sox17 (endoderm marker), Brachyury (mesoderm marker) and co‐staining with DAPI (blue) in embryoid bodies (EBs) derived from hiPSCs‐SLE. Scale bar, 50 μm. Image collected and cropped by CiteAb from the following publication (https://pubmed.ncbi.nlm.nih.gov/31536674), licensed under a CC-BY licence.
Detection of Human SOX17 by Immunocytochemistry/Immunofluorescence.
Concordant expression of developmental programs across organoids from human iPSC lines. IF staining of D29 kidney organoid (AS line, ML protocol) for SOX17 and CD31, markers of endothelial cells. Image collected and cropped by CiteAb from the following publication (https://pubmed.ncbi.nlm.nih.gov/31784515), licensed under a CC-BY licence.
Detection of Human SOX17 by Immunocytochemistry/Immunofluorescence.
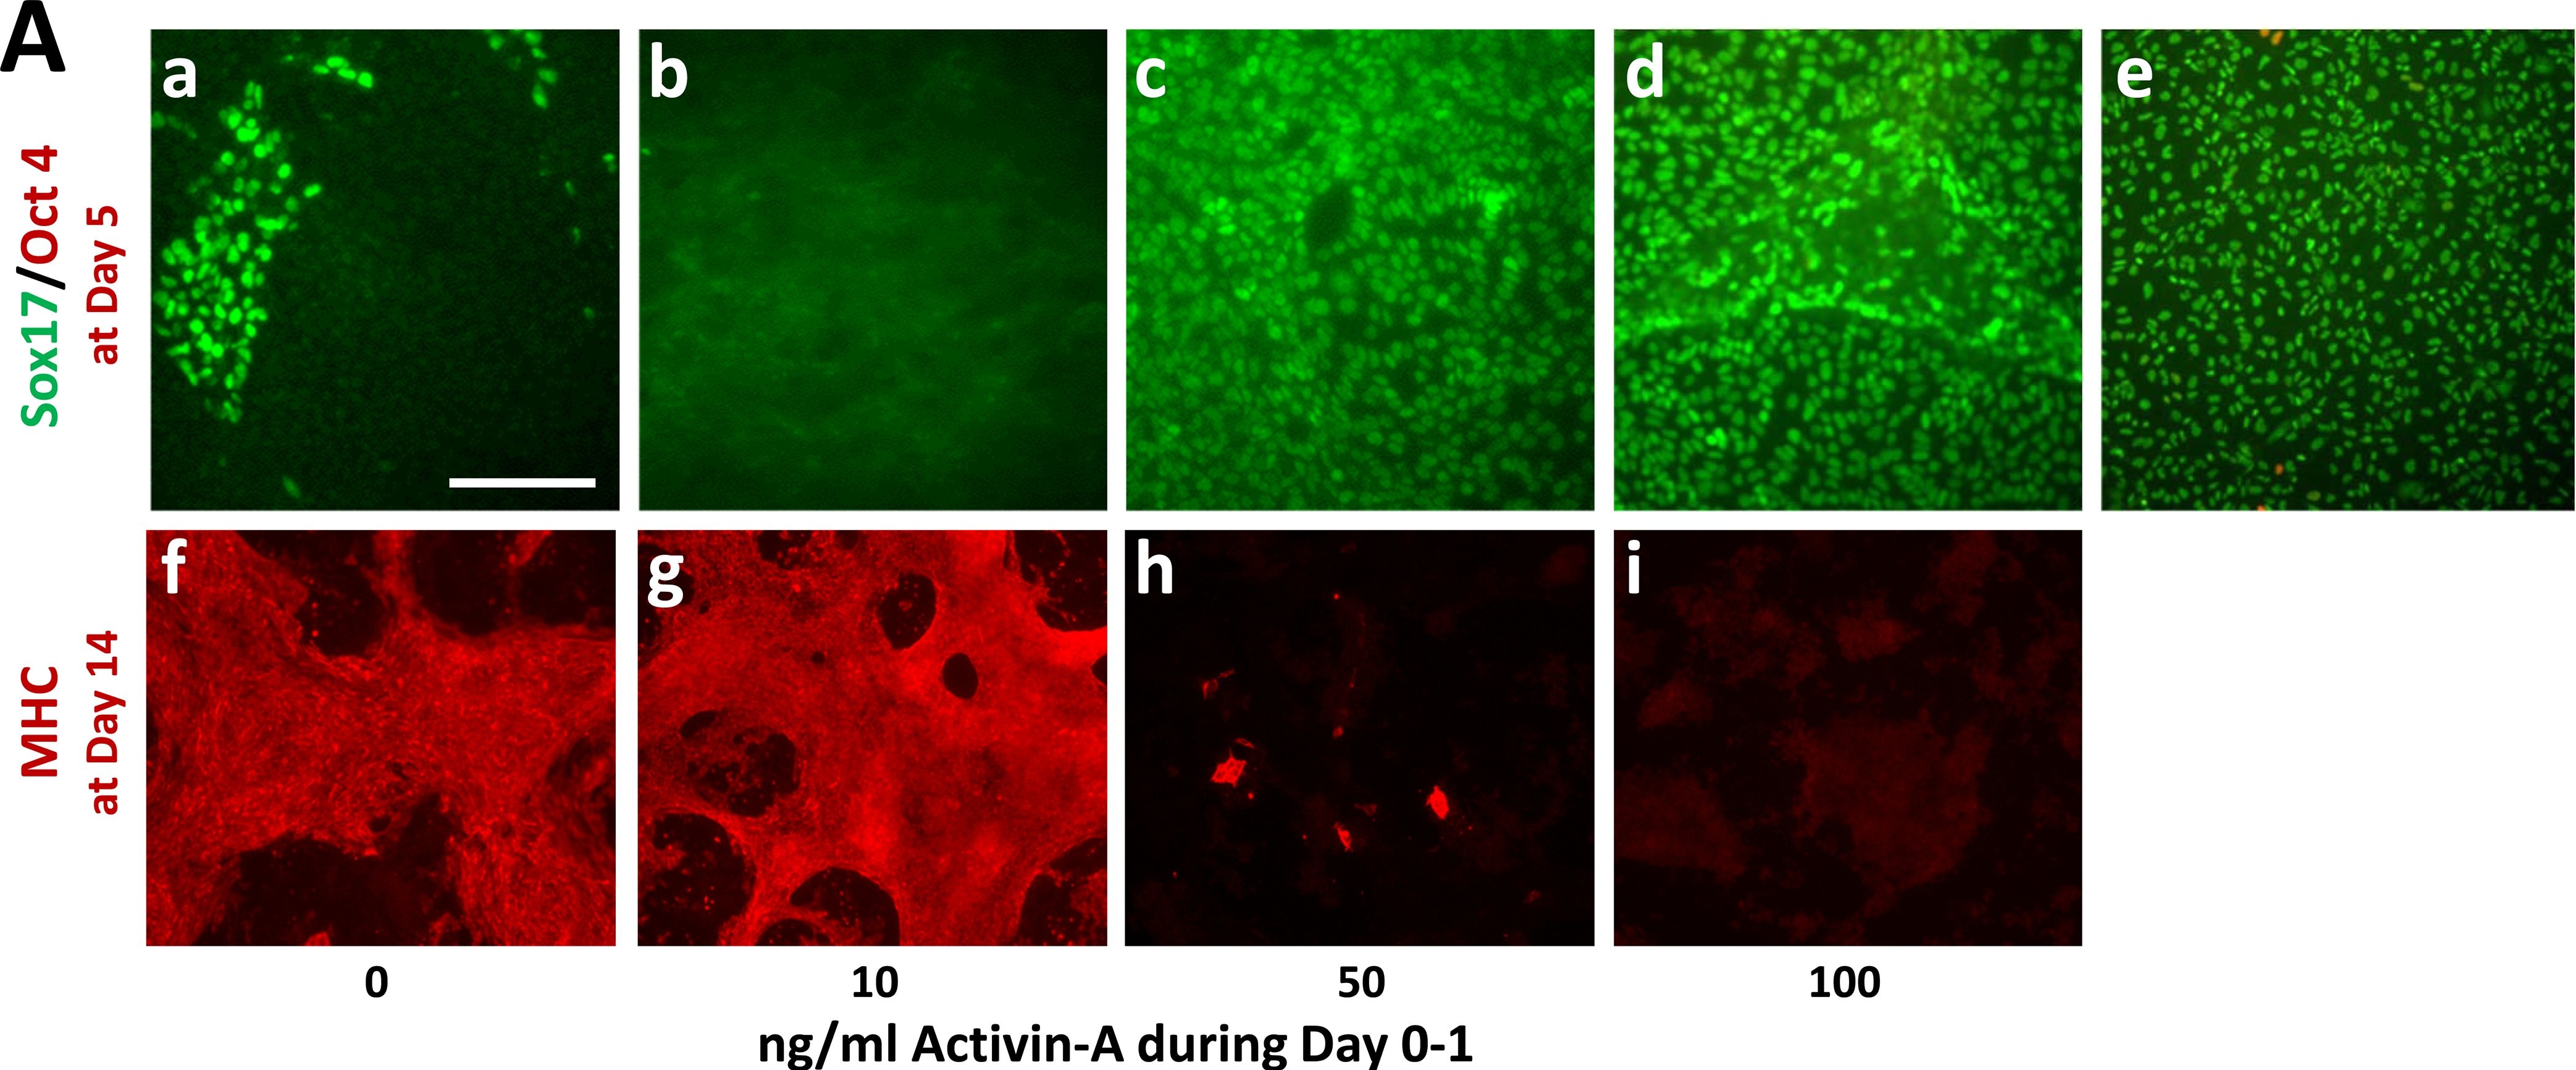
Activin-A levels during Day 0–1 modulate cardiomyocyte (CM) vs. definitive endoderm (DE) differentiation. Pluripotent H1 ESCs were induced by changing medium to RPMI/B27 (no insulin), including CHIR (7.5 μmol/L) during Day 0–1 and IWP (5 μmol/L) during Days 3–5. Activin-A was included at the indicated levels during Day 0–1. Insulin (4,000 ng/ml) was included after Day 7. a-e shows cells double-immunostained on Day 5 for Oct4 (red) and Sox17 (green); e is a positive control wherein cells were induced to DE with Activin-A (50 ng/ml) and Bmp4 (10 ng/ml) during Days 0–5. f-i shows cells immunostained with MF20 mAb on Day 14 to detect cardiomyocytes. Scale bar: 200 μm. Image collected and cropped by CiteAb from the following publication (https://dx.plos.org/10.1371/journal.pone.0118670), licensed under a CC-BY licence.
Detection of Human SOX17 by Immunocytochemistry/Immunofluorescence.
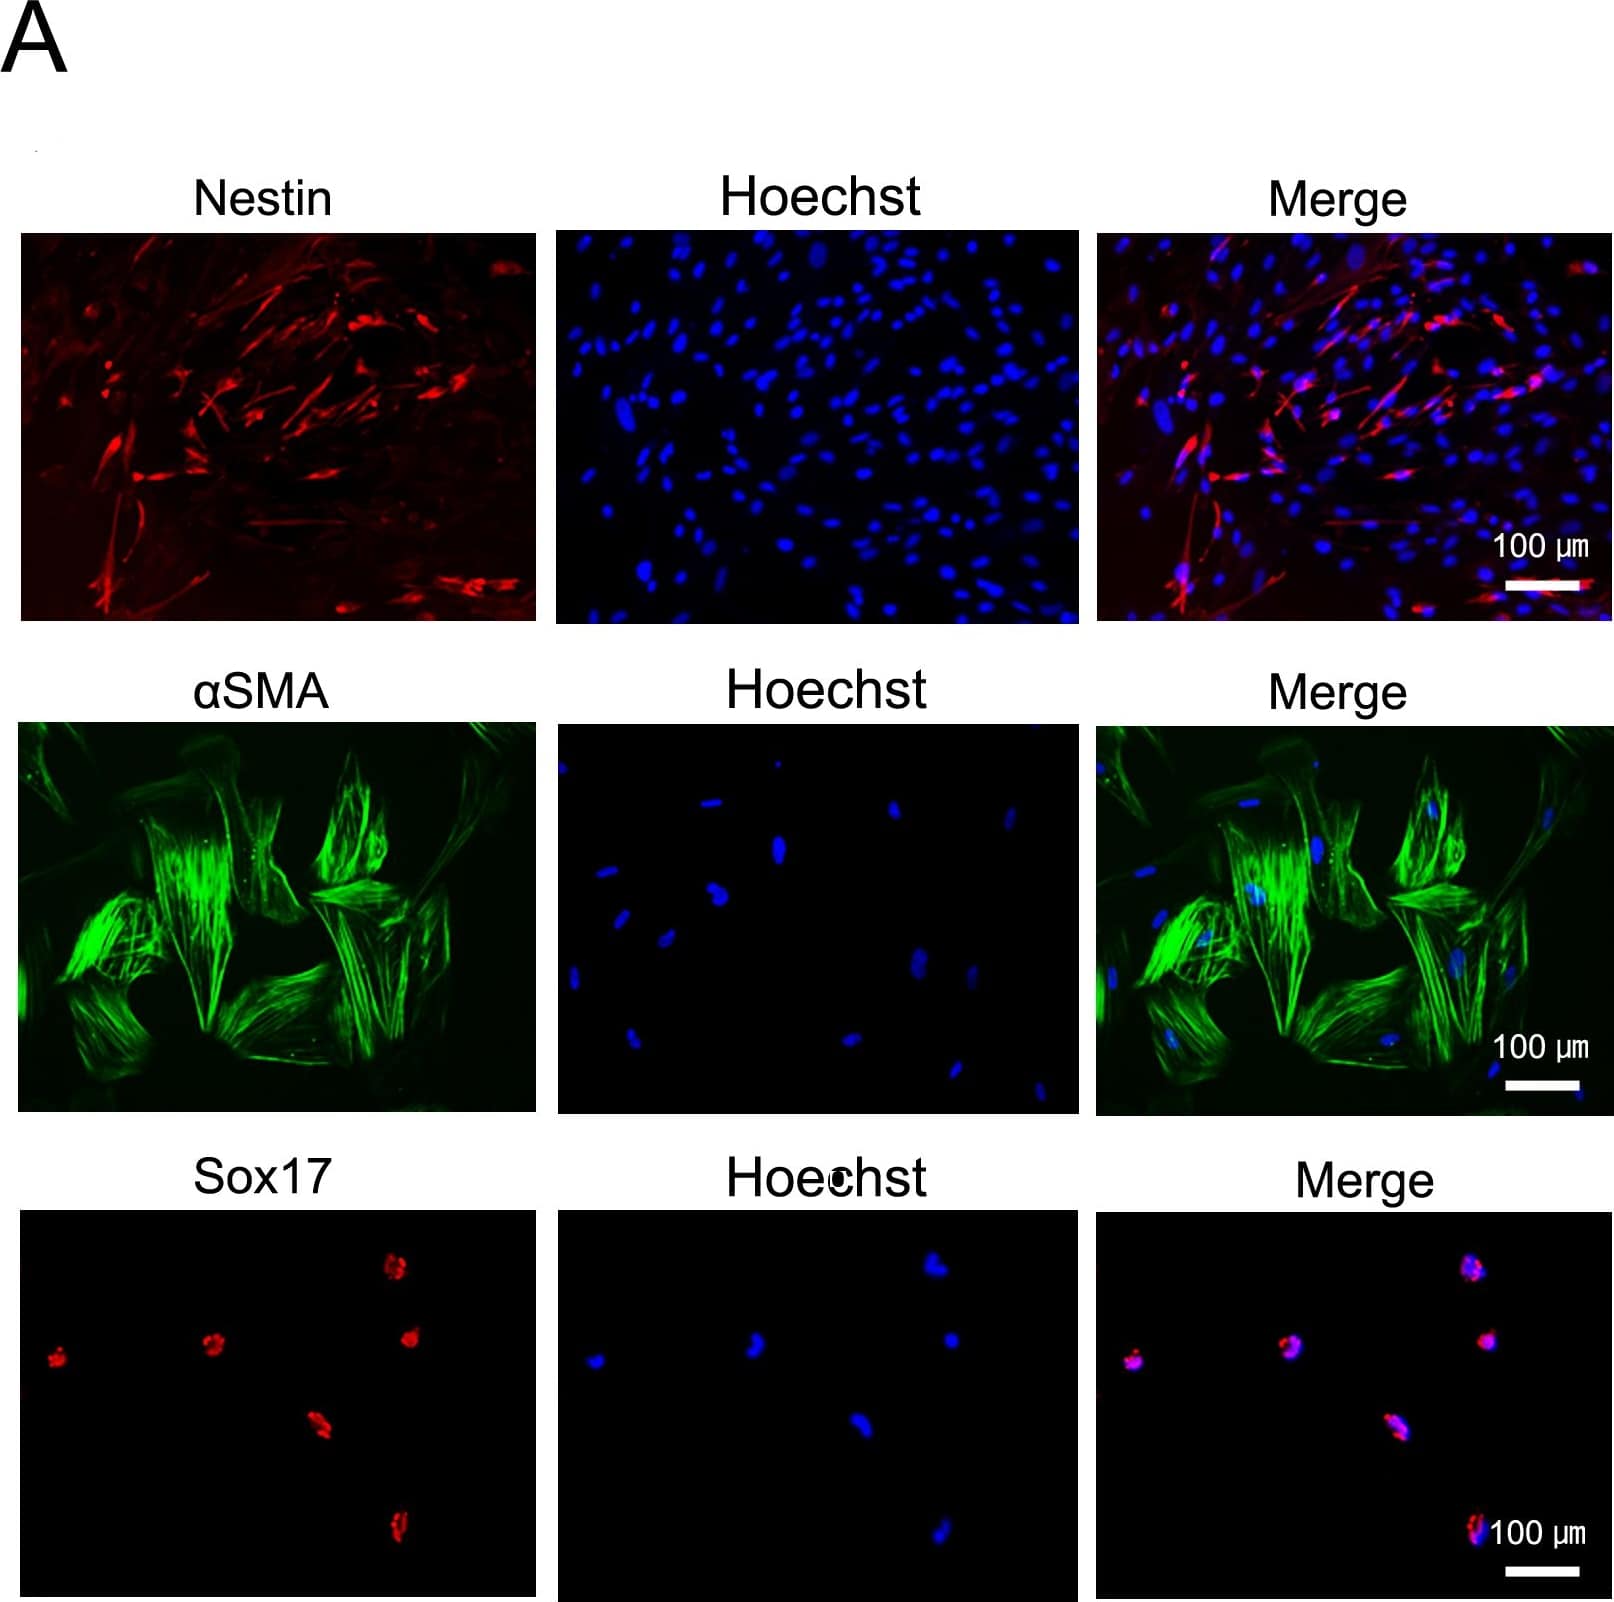
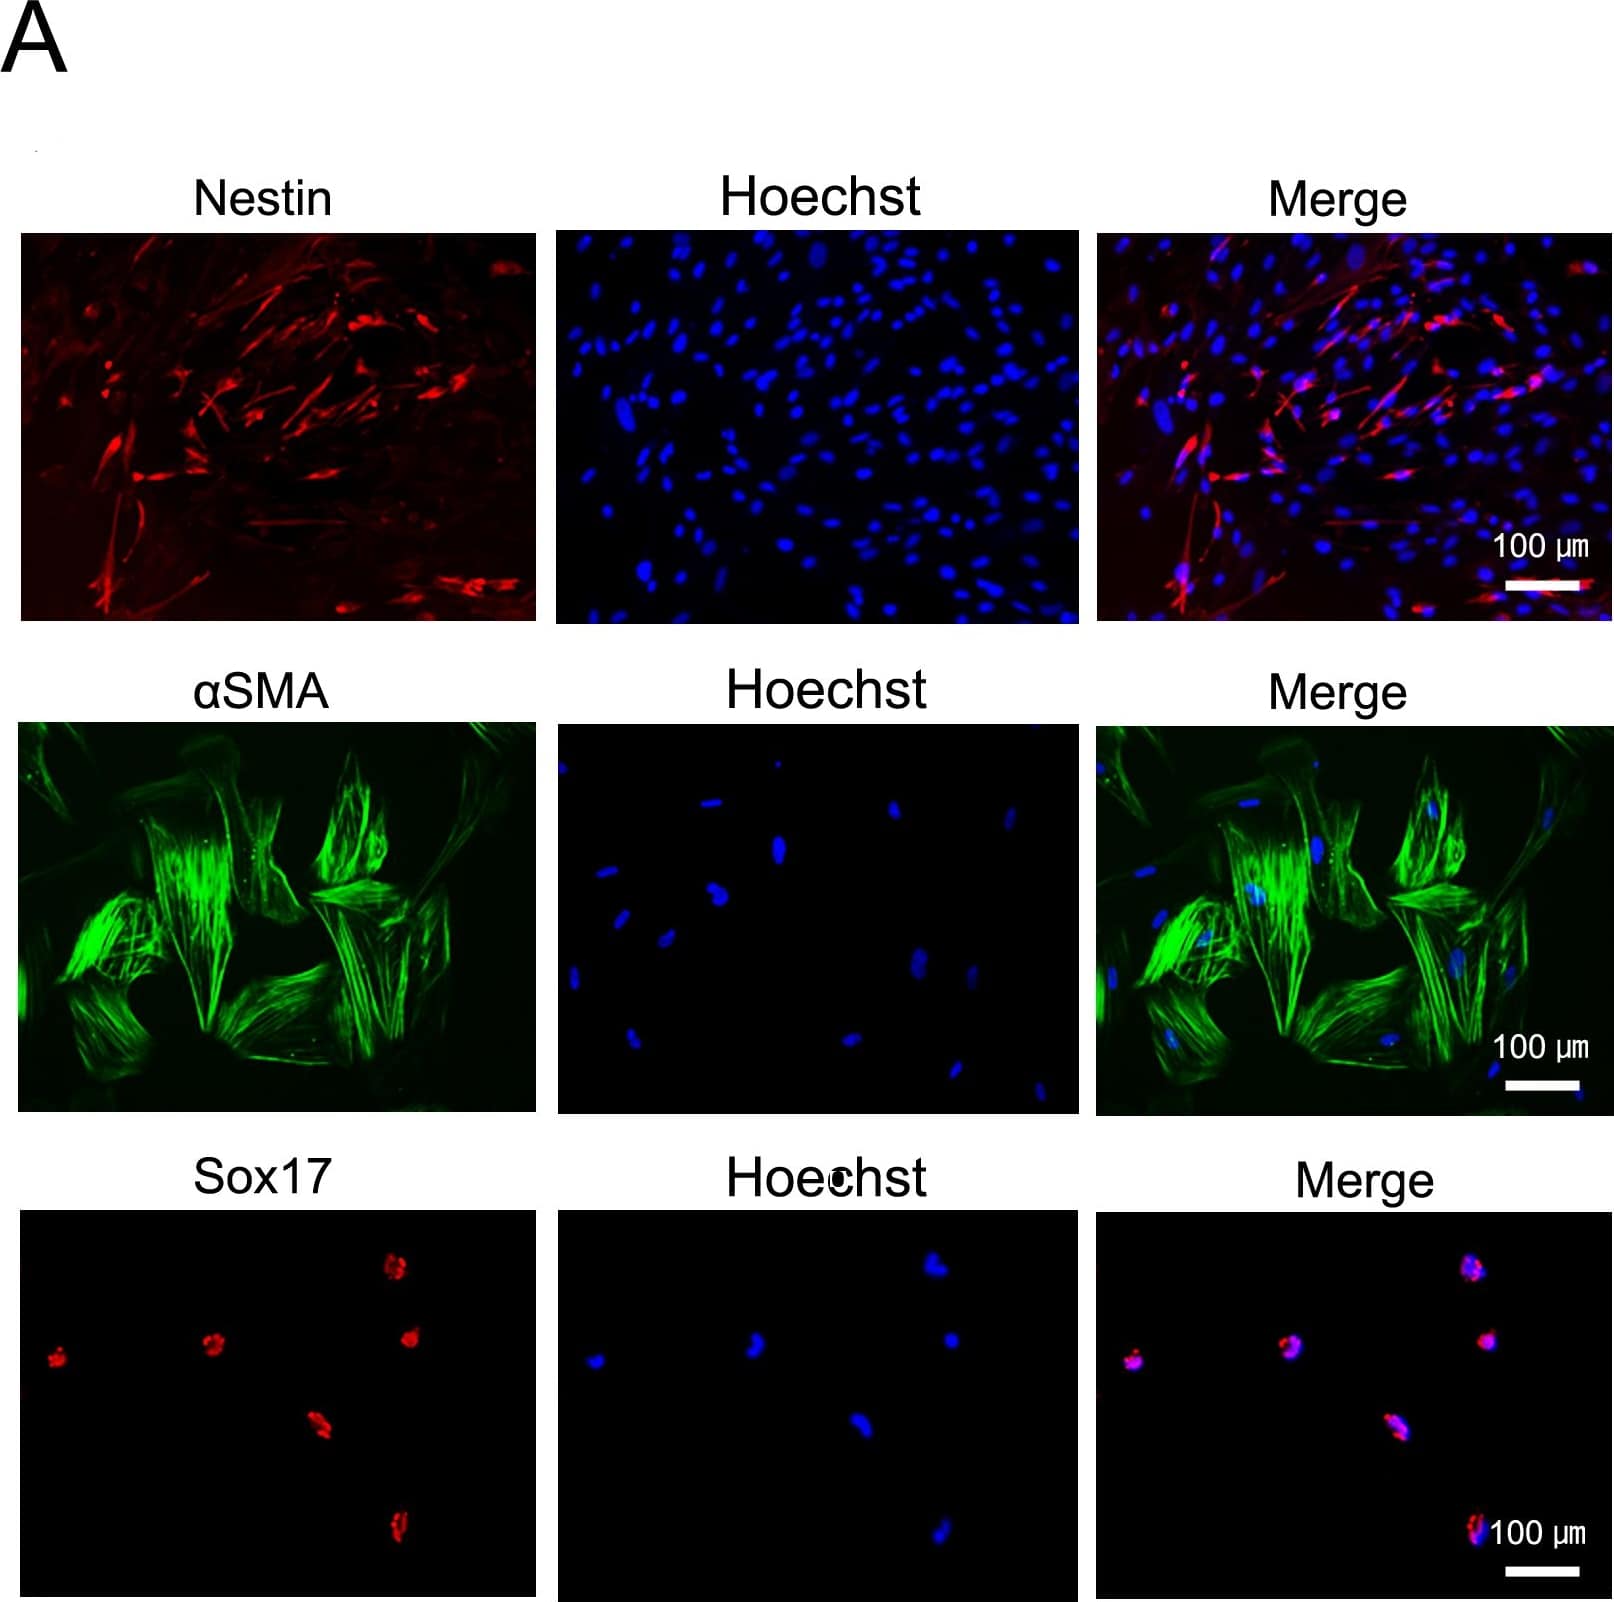
In vitro and in-TiPSCs. Immunofluorescence staining for Sox17 (endodermal marker), alphaSMA (mesodermal marker), and Nestin (ectodermal marker) in each human TiPSCs1-derived differentiated cell in vitro. Image collected and cropped by CiteAb from the following publication (https://dx.plos.org/10.1371/journal.pone.0097397), licensed under a CC-BY licence.
Detection of Human SOX17 by Immunocytochemistry/Immunofluorescence.
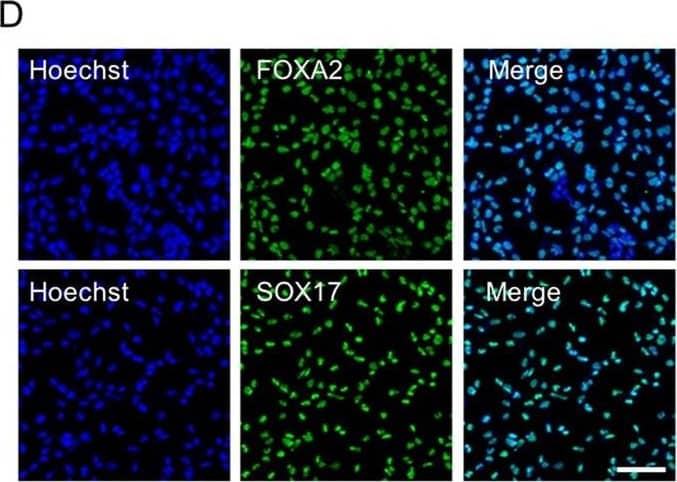
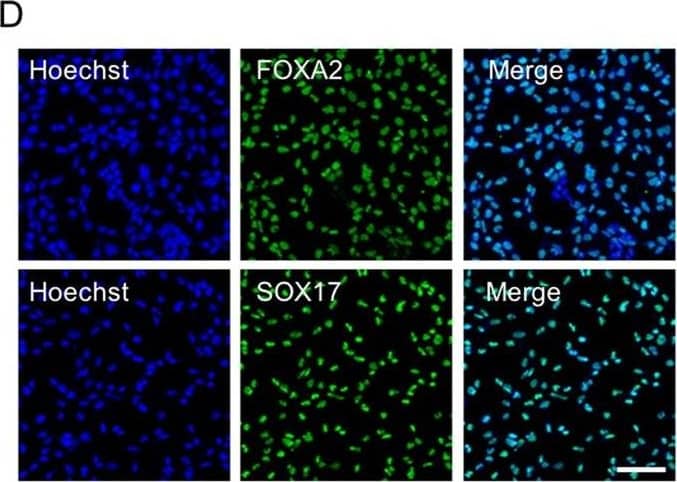
Differentiation of hESCs into definitive endoderm cells by Activin A with CHIR99021. Immunofluorescence analysis of the expression of SOX17 and FoxA2 for Activin A with 2 µM CHIR99021-induced differentiated cells on day 3. Scale bar, 100 µm. Image collected and cropped by CiteAb from the following publication (https://pubmed.ncbi.nlm.nih.gov/31601782), licensed under a CC-BY licence.
Detection of Mouse SOX17 by Western Blot.
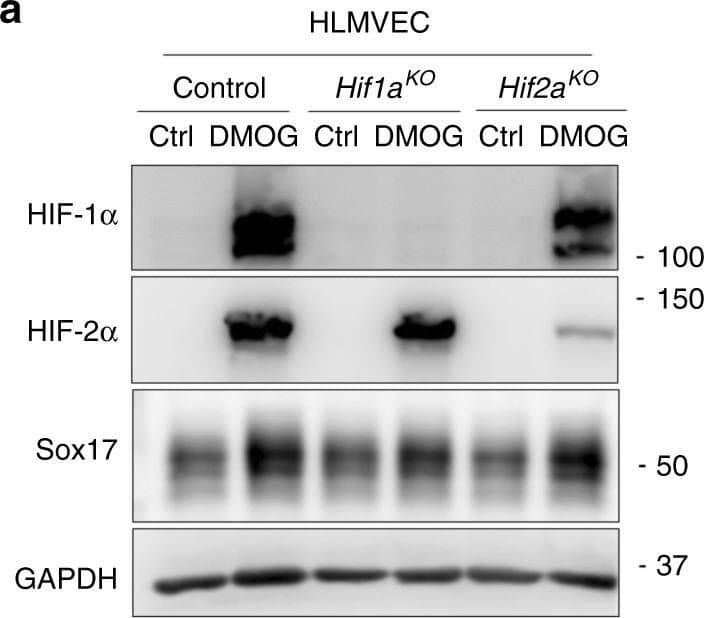
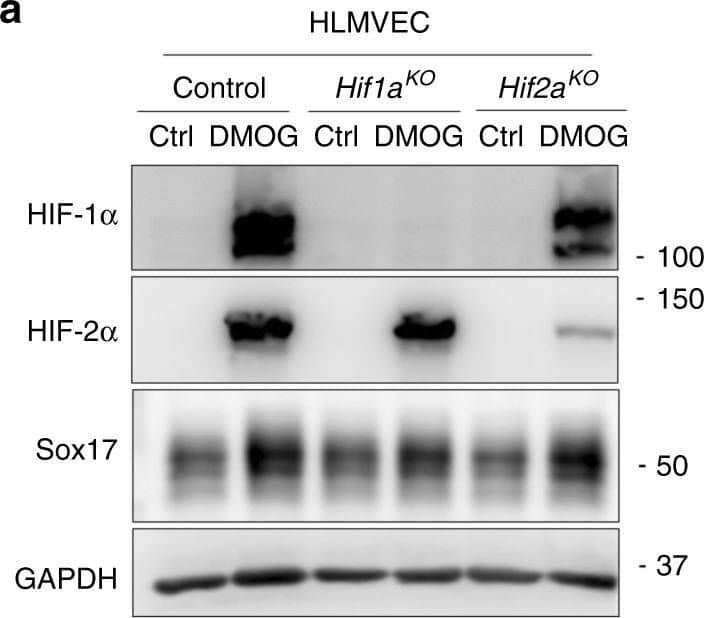
HIF-1 alpha activates transcription of Sox17. Western blot analysis in control human lung microvascular endothelial cells (HLMVECs) and HLMVECs for which CRISPR/Cas9 was used to delete HIFs. ECs were treated with the HIF prolyl hydroxylase inhibitor DMOG to induce HIF expression. DMOG (1 mM) increased HIF-1 alpha and HIF-2 alpha protein expression in control ECs but not in ECs lacking HIF-1 alpha or HIF-2 alpha. Induction of HIF expression was coupled to Sox17 upregulation. n = 3. Image collected and cropped by CiteAb from the following publication (https://pubmed.ncbi.nlm.nih.gov/31073164), licensed under a CC-BY licence.
Detection of Mouse SOX17 by Immunocytochemistry/Immunofluorescence.
Features of ESC-INTPSCs intermediate between ESCs and EpiSCs. Expression of OCT3/4 and SOX17. Scale bar, 100 µm. Image collected and cropped by CiteAb from the following publication (https://dx.plos.org/10.1371/journal.pone.0095329), licensed under a CC-BY licence.
Detection of Mouse SOX17 by Immunocytochemistry/Immunofluorescence.
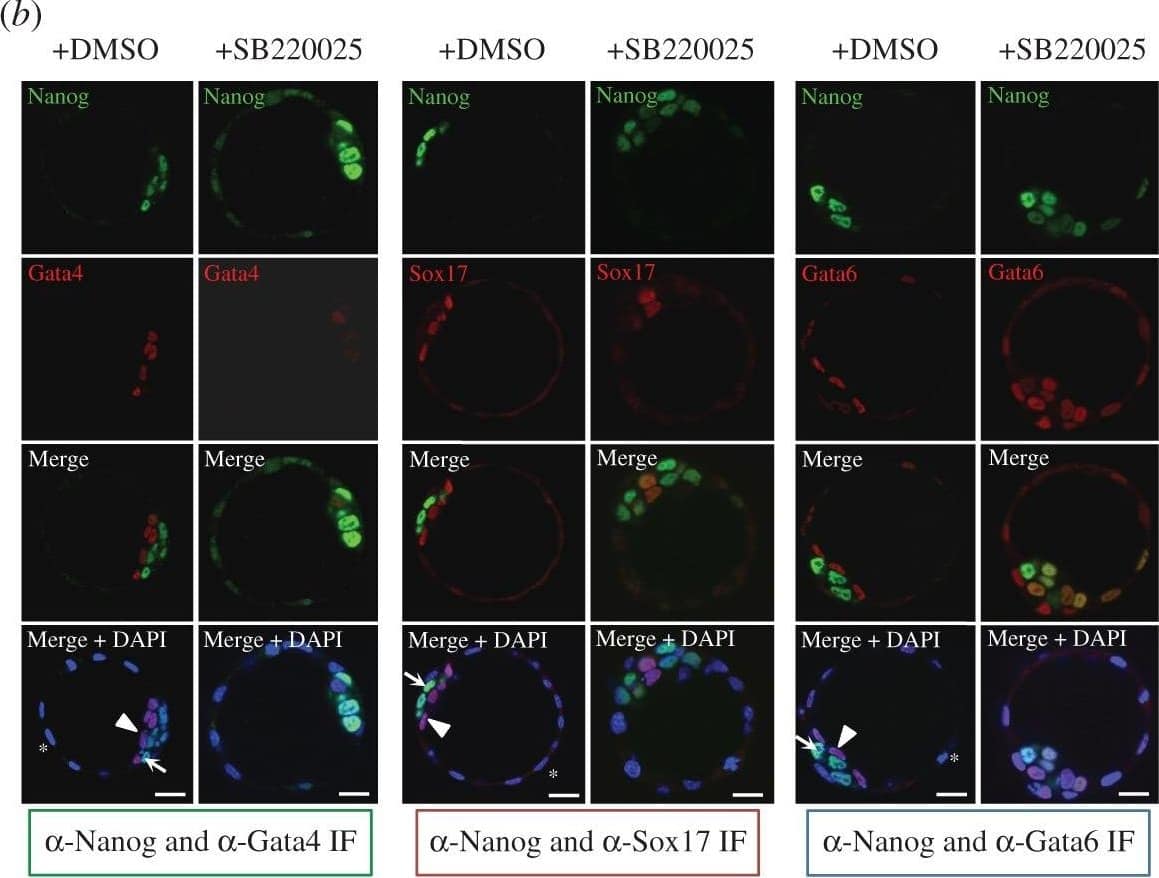
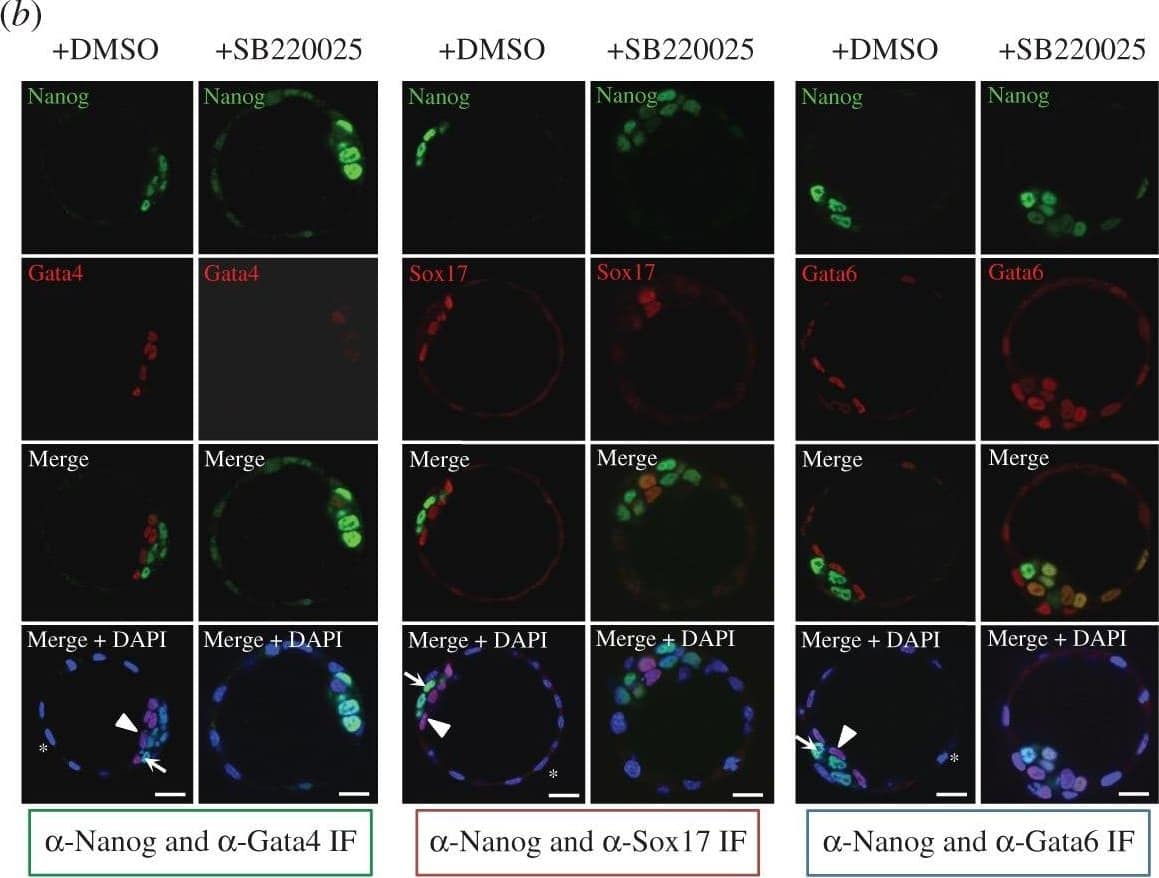
p38-Mapk14/11 inhibition during murine blastocyst maturation blocks primitive endoderm (PrE) differentiation/maturation. Representative single confocal z-plane micrographs of vehicle control-treated (+DMSO) or p38-Mapk14/11 inhibited (+SB220025) late-blastocyst stage/equivalent embryos, immunofluorescently stained for indicated ICM cell lineage markers (Nanog in green and Gata4, Sox17 and Gata6 in red, plus DAPI DNA stain in blue). Examples of cells classified as TE, PrE and EPI are marked with an asterisk, arrowhead and arrow, respectively. Scale bar, 15 µm. Image collected and cropped by CiteAb from the following publication (https://pubmed.ncbi.nlm.nih.gov/27605380), licensed under a CC-BY licence.
Detection of Mouse SOX17 by Western Blot.
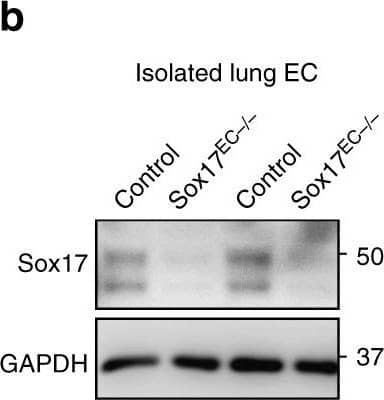
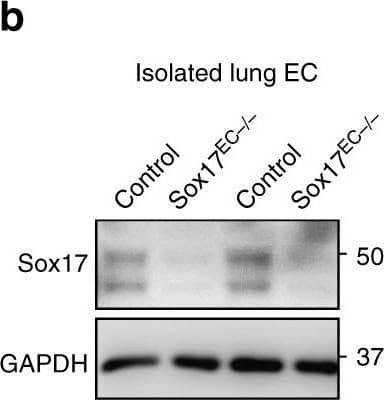
Endothelial cell (EC) specific deletion of Sox17 (Sox17EC−/−) in mice prevents endothelial regeneration. Western blot analysis of Sox17 protein expression in isolated ECs obtained from flushed lungs of Sox17EC−/− and control mice. n = 4. Image collected and cropped by CiteAb from the following publication (https://pubmed.ncbi.nlm.nih.gov/31073164), licensed under a CC-BY licence.
Detection of Mouse SOX17 by Immunocytochemistry/Immunofluorescence
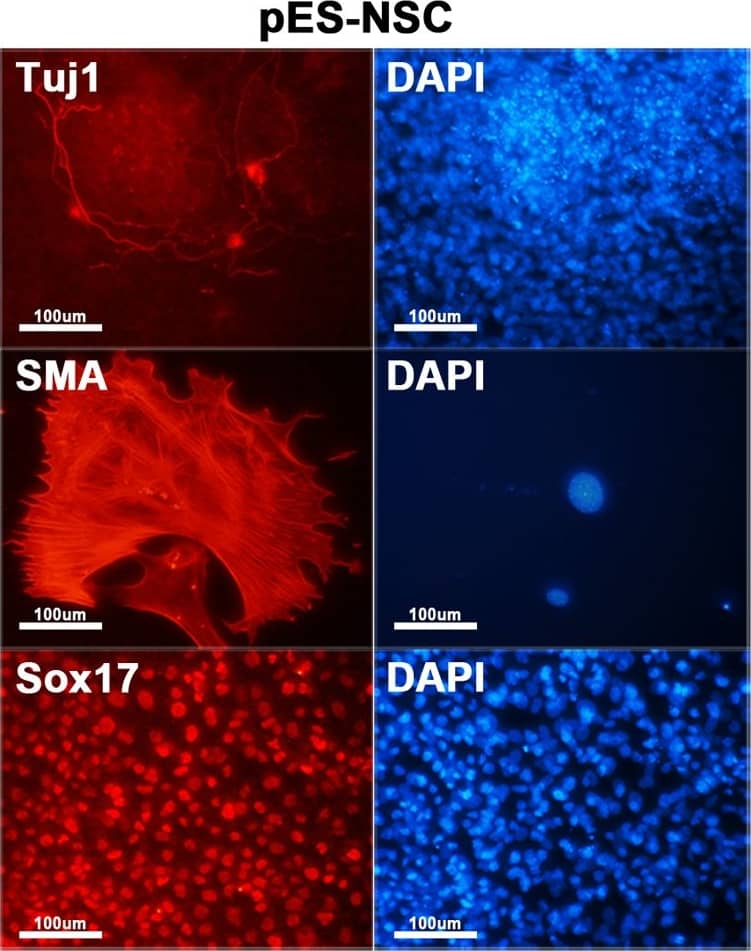
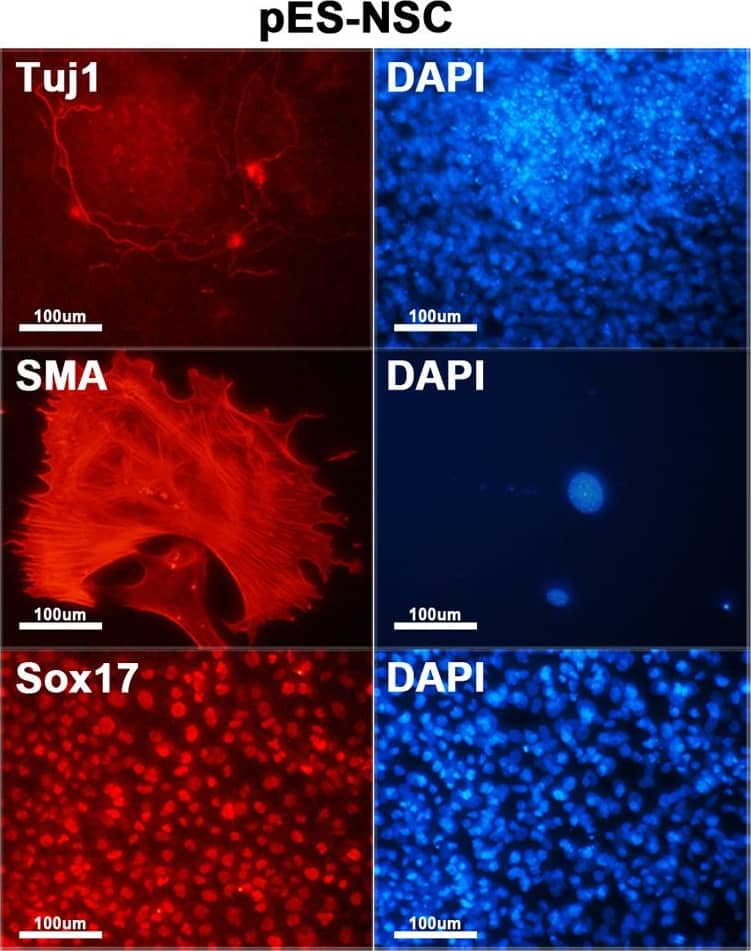
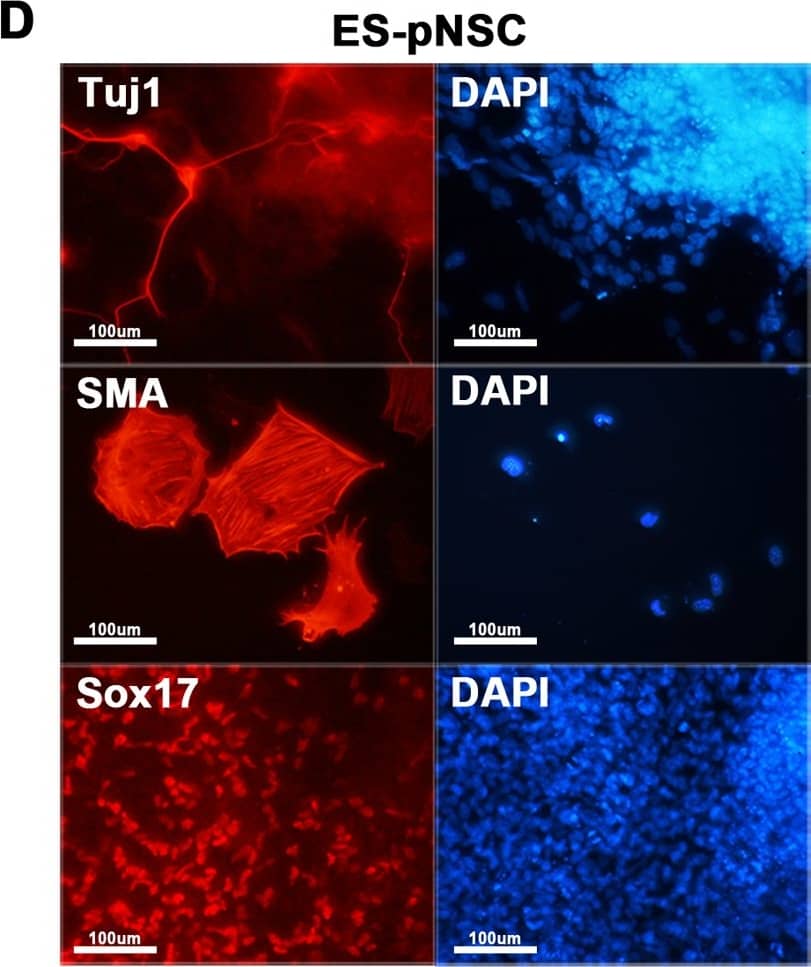
Characterization of hybrid cells.(A) Both ES-pNSC and pES-NSC hybrid cells are positive for alkaline phosphatase staining (100 ×). (B) RT-PCR analysis of Oct4, Nanog, Sox2, and Nestin expression in fusion partner and reprogrammed hybrid cells. Pluripotency markers, Oct4 and Nanog, which were not expressed in NSCs and pNSCs were expressed in GFP+ fusion hybrid cells. On the other hand, Nestin, which was expressed in NSCs and pNSCs was silenced after forming GFP+ fusion hybrid cells. (C) Immunocytochemistry analysis of Oct4 and Nanog in ES-pNSC and pES-NSC hybrid cells (100 ×). (D)In vitro differentiation of ES-pNSC and pES-NSC hybrid cells into ectoderm (Tuj1), mesoderm (SMA), and endoderm (Sox17) lineages (200 ×). (E) In vivo differentiation potential of ES-pNSC and pES-NSC hybrid cells through teratoma assay. These hybrid cells were contributed to secretory epithelium (ectoderm), cartilage (mesoderm) and gut epithelium (endoderm), which were stained with PAS, Asian blue, and hematoxylin eosin, respectively. Each tissue was indicated by arrow head. Image collected and cropped by CiteAb from the following publication (https://dx.plos.org/10.1371/journal.pone.0156491), licensed under a CC-BY license. Not internally tested by R&D Systems.
Detection of Human SOX17 by Immunocytochemistry/Immunofluorescence
In vitro and in-TiPSCs.(A): Immunofluorescence staining for Sox17 (endodermal marker), alphaSMA (mesodermal marker), and Nestin (ectodermal marker) in each TiPSCs1-derived differentiated cell in vitro. (B): Gross morphology of representative teratomas derived from TiPSCs1 in vivo (hematoxylin and eosin staining). Image collected and cropped by CiteAb from the following publication (https://dx.plos.org/10.1371/journal.pone.0097397), licensed under a CC-BY license. Not internally tested by R&D Systems.
Detection of Mouse SOX17 by Immunocytochemistry/Immunofluorescence
Characterization of hybrid cells.(A) Both ES-pNSC and pES-NSC hybrid cells are positive for alkaline phosphatase staining (100 ×). (B) RT-PCR analysis of Oct4, Nanog, Sox2, and Nestin expression in fusion partner and reprogrammed hybrid cells. Pluripotency markers, Oct4 and Nanog, which were not expressed in NSCs and pNSCs were expressed in GFP+ fusion hybrid cells. On the other hand, Nestin, which was expressed in NSCs and pNSCs was silenced after forming GFP+ fusion hybrid cells. (C) Immunocytochemistry analysis of Oct4 and Nanog in ES-pNSC and pES-NSC hybrid cells (100 ×). (D)In vitro differentiation of ES-pNSC and pES-NSC hybrid cells into ectoderm (Tuj1), mesoderm (SMA), and endoderm (Sox17) lineages (200 ×). (E) In vivo differentiation potential of ES-pNSC and pES-NSC hybrid cells through teratoma assay. These hybrid cells were contributed to secretory epithelium (ectoderm), cartilage (mesoderm) and gut epithelium (endoderm), which were stained with PAS, Asian blue, and hematoxylin eosin, respectively. Each tissue was indicated by arrow head. Image collected and cropped by CiteAb from the following publication (https://dx.plos.org/10.1371/journal.pone.0156491), licensed under a CC-BY license. Not internally tested by R&D Systems.
Detection of Mouse SOX17 by Western Blot
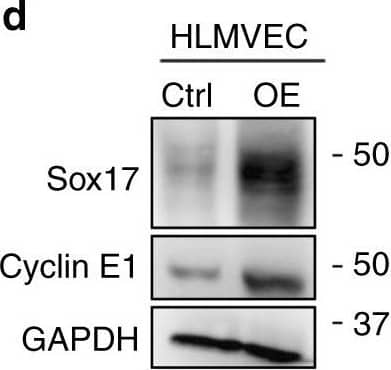
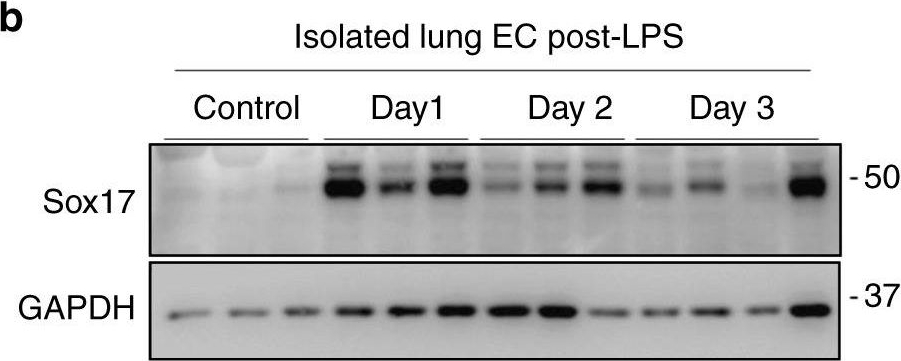
Activation of Sox17 at onset of EC regeneration and Sox17-mediated Cyclin E1 expression. a qPCR analysis of gene expression in sorted CD31+ cells from mTmG-Scl mice before and after injury (12 mg/kg i.p.). Sox17, Vegfr2, and Ccne1 increased significantly at day 2 post-LPS compared to baseline. n = 3. Color scale: the fold change increases from red to white to green color. b Western blot analysis in fresh isolated ECs from wild-type mice and quantification c showed a 5-fold increase in Sox17 protein expression within 1 day following injury compared to baseline and followed by recovery within 3 days post-LPS. n = 3. d, e Western blot analysis of cultured HLMVECs in which Sox17 was overexpressed showed 2.5x fold increase in Cyclin E1 protein expression relative to control cells. n = 3. OE, overexpression. f Representation of the CCNE1 promoter region with Sox17 binding sites (circled numbers) and their sequences. g HLMVECs were retrovirally transduced with Sox17 or control plasmid for 3 days, and Ch-IP assay followed by qPCR was performed to amplify Sox17 binding sites in the CCNE1 promoter. n = 3. h 293T cells were transfected with a Sox17 overexpression plasmid containing CCNE1 luciferase reporter constructs. Luciferase values were normalized to Renilla luciferase control reporter values. A schematic representation of corresponding deletion constructs is presented in the right panel. n = 3 and duplicates per sample. **P < 0.01 and ***P < 0.001. Data are shown as mean ± SEM. Analysis was performed using one-way ANOVA for (c) and two-way ANOVA with Bonferroni post-tests for (e, g, h) Image collected and cropped by CiteAb from the following publication (https://pubmed.ncbi.nlm.nih.gov/31073164), licensed under a CC-BY license. Not internally tested by R&D Systems.
Detection of Human SOX17 by Immunocytochemistry/Immunofluorescence
Generation and characterization of systemic lupus erythematosus (SLE)‐specific human‐induced pluripotent stem cells (hiPSCs). (A) Dermal fibroblasts derived from patient with SLE were reprogrammed into iPSCs using Sendai virus vectors and three clones (#1, #2 and #3) were characterized. RT‐PCR confirms the loss of transgenes in hiPSCs‐SLE (lanes 1, 2 and 3), presence (lane 4) in infected fibroblasts (ipF‐SLE) and absence of Sendai viral transgenes in parental fibroblasts (pF‐SLE) (lane 5). Full‐length gels are presented in File S2. (B) The hiPSCs‐SLE colonies expressed alkaline phosphatase. Scale bar, 500 μm. (C) RT‐qPCR analysis of pluripotency genes OCT4, NANOG, SOX2 and REX1 was performed in fibroblasts and in hiPSCs derived from patient with SLE. All expression values are normalized to GAPDH and relative donor fibroblasts. Data are mean ± SEM and all statistical analysis was made between hiPSCs‐SLE clones and relative fibroblasts by Student's t test showing P‐values ≤ .05 in each comparison. (D) PluriTest assays combines novelty score (blue) on x‐axis and pluripotency score (red) on y‐axis. hiPSCs‐SLE localize in the red cloud suggesting the empirical distribution of pluripotent cells compared to non‐pluripotent blue cloud. (E) Representative images of M‐FISH staining show normal karyotypes of hiPSCs‐SLE clones. (F) Immunofluorescence analysis of pluripotent stem cell markers Nanog (green), Oct4 (red) and co‐staining with DAPI (blue) in hiPSCs‐SLE. Scale bar, 50 μm. (G) Representative images of floating and adherent EBs derived from hiPSCs‐SLE at differentiation day 8 and 18, respectively. Scale bar, 500 μm. (H) RT‐qPCR results confirm the capability of hiPSCs‐SLE to differentiate into all three germ layers. The expression levels of GATA4, HAND1 and PAX6 in EBs are relative to undifferentiated hiPSCs. All expression values are normalized to GAPDH and relative hiPSCs. Data are mean ± SEM and all statistical analysis was made between EBs‐SLE and relative hiPSCs‐SLE clones by Student's t test showing P‐values ≤ .05 in each comparison. (I) Immunostaining of Otx2 (ectoderm marker), Sox17 (endoderm marker), Brachyury (mesoderm marker) and co‐staining with DAPI (blue) in EBs derived from hiPSCs‐SLE. Scale bar, 50 μm Image collected and cropped by CiteAb from the following publication (https://pubmed.ncbi.nlm.nih.gov/31536674), licensed under a CC-BY license. Not internally tested by R&D Systems.
Detection of Mouse SOX17 by Western Blot
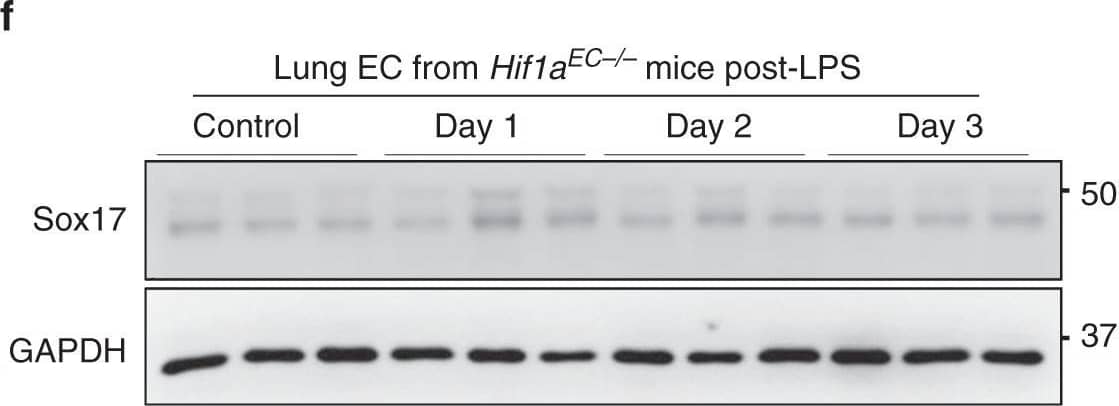
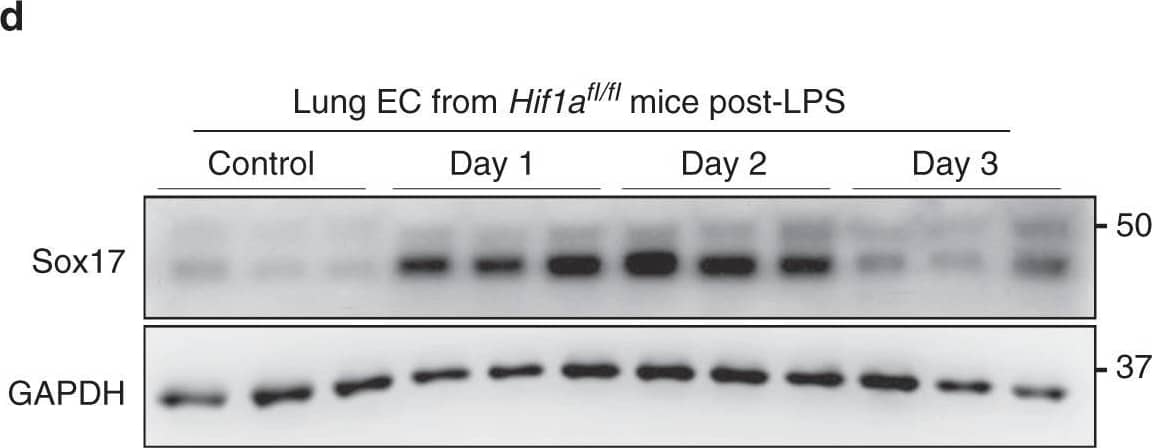
soHIF-1 alpha signaling induces Sox17 expression. a MPO activity of flushed lung sample from mice challenged with LPS (12 mg/kg i.p.) for 6 and 24 h. n = 3. b Western blot analysis of wild-type mice lung before and after LPS-induced injury (12 mg/kg i.p.) and its quantification c showed that HIF-1 alpha protein expression increased within 6 h post-LPS and remained increased until day 2. n = 3. d Western blot analysis in freshly isolated ECs from Hif1afl/fl mice and quantification e showed significantly increased Sox17 protein expression after injury when compared to baseline levels. n = 3. f Western blot analysis in freshly isolated ECs from Hif1aEC−/− mice and quantification g showed no significant difference in Sox17 protein expression before and after injury. n = 3. **P < 0.01 and ***P < 0.001. Data are shown as mean ± SEM. Analysis was performed using one-way ANOVA for (b, c, e, g). Image collected and cropped by CiteAb from the following publication (https://pubmed.ncbi.nlm.nih.gov/31073164), licensed under a CC-BY license. Not internally tested by R&D Systems.
Detection of Human SOX17 by Immunocytochemistry/Immunofluorescence
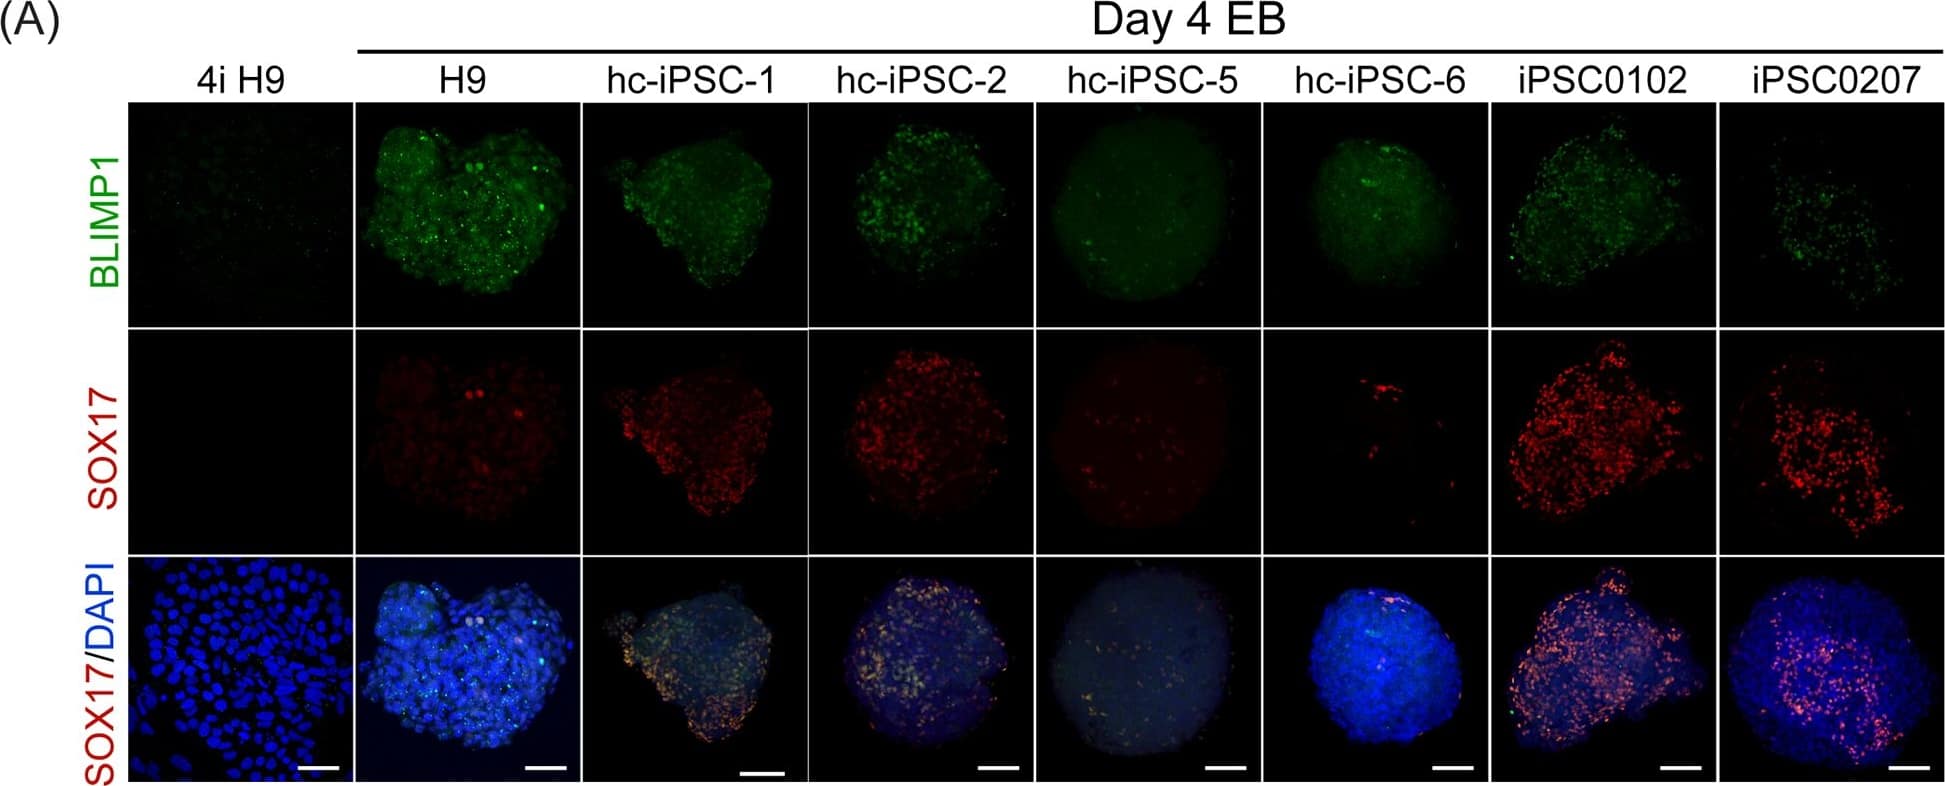
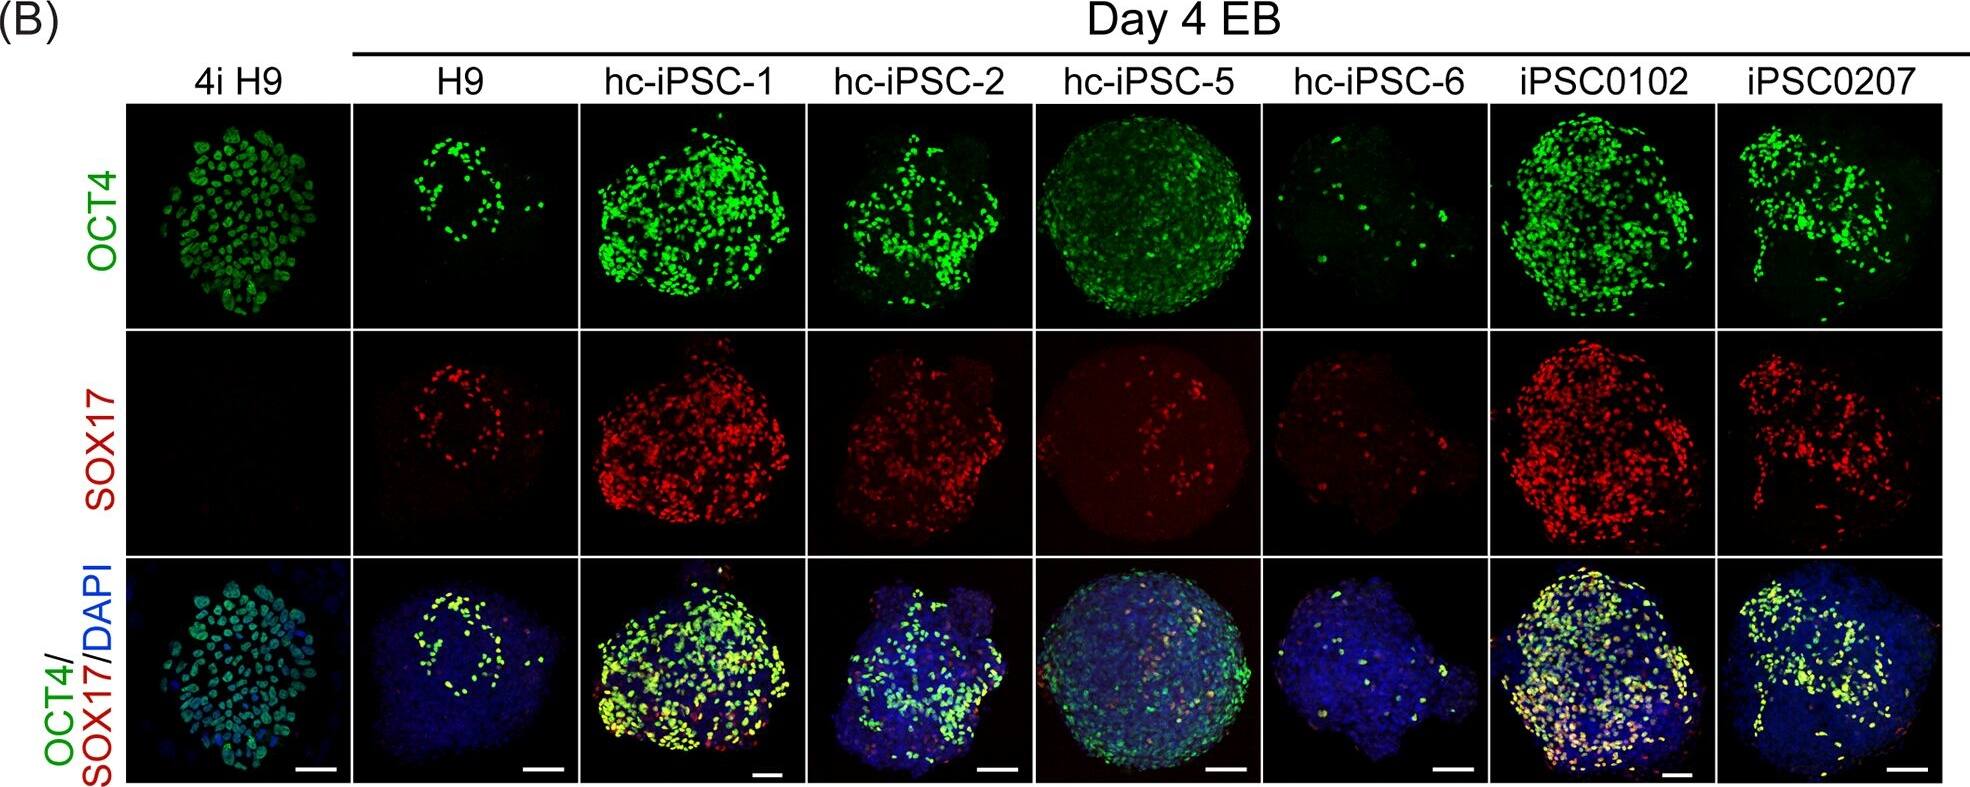
PGCLCs derived from hc-iPSCs.Immunofluorescent staining of (A) BLIMP1 (green color) and (B) OCT4 (green color) in 4-day-old EBs cultured with PGC induction medium on hc-iPSC-1, -2, -5 and -6 (third to fifth column), PBMC derived iPSC0102 and iPSC0207 (right two column). H9 hESCs (left column) adapted in 4i medium was also detected for BLIMP1 and OCT4 antibodies. Noted that there was no BLIMP1 signals detected in undifferentiated H9 in 4i condition. All samples were doubly stained with SOX17 antibody (red color) sequentially. DAPI was used for counterstain (blue). Scale bar = 50μm. (C) Quantification of immunofluoresent staining of PGCLCs. BLIMP1/SOX17 and OCT4/SOX17 double positive cells were counted for PGCLCs and normalized with the number of DAPI. Percentage of PGCLCs per EB of all lines was presented and significance was compared with control hESC H9. ** indicates P<0.005. *** indicates P<0.001. Image collected and cropped by CiteAb from the following publication (https://dx.plos.org/10.1371/journal.pone.0165715), licensed under a CC-BY license. Not internally tested by R&D Systems.
Detection of Human SOX17 by Immunocytochemistry/Immunofluorescence
Activin-A levels during Day 0–1 modulate CM vs. DE differentiation.Pluripotent H1 ESCs were induced by changing medium to RPMI/B27 (no insulin), including CHIR (7.5 μmol/L) during Day 0–1 and IWP (5 μmol/L) during Days 3–5. Activin-A was included at the indicated levels during Day 0–1. Insulin (4,000 ng/ml) was included after Day 7. Panel A, a-e shows cells double-immunostained on Day 5 for Oct4 (red) and Sox17 (green); e is a positive control wherein cells were induced to DE with Activin-A (50 ng/ml) and Bmp4 (10 ng/ml) during Days 0–5. Panel A f-i shows cells immunostained with MF20 mAb on Day 14 to detect cardiomyocytes. Panel B depicts the effect of Activin-A levels during Day 0–1 on cardiomyocyte differentiation at Day 14, determined by flow cytometry using anti-cTnT. Cultures treated with 10 ng/ml Activin-A began to rhythmically contract at Day 6. Cells treated with 50 or 100 ng/ml Activin-A did not beat at any time. Bars indicate the average values combined from multiple experiments. Vertical lines = ±SEM. P-values were calculated by Student’s t-test. The p-value over the bar denoting 10 ng/ml Activin-A is relative to cells treated with CHIR only (0 ng/ml Activin-A), whereas the p-values over the bars denoting 50 and 100 ng/ml Activin-A are relative to cells treated with 10 ng/ml Activin-A. The size bar in Aa, which pertains to panels a-i, = 200 μm. Image collected and cropped by CiteAb from the following publication (https://dx.plos.org/10.1371/journal.pone.0118670), licensed under a CC-BY license. Not internally tested by R&D Systems.
Detection of Mouse SOX17 by Immunocytochemistry/Immunofluorescence
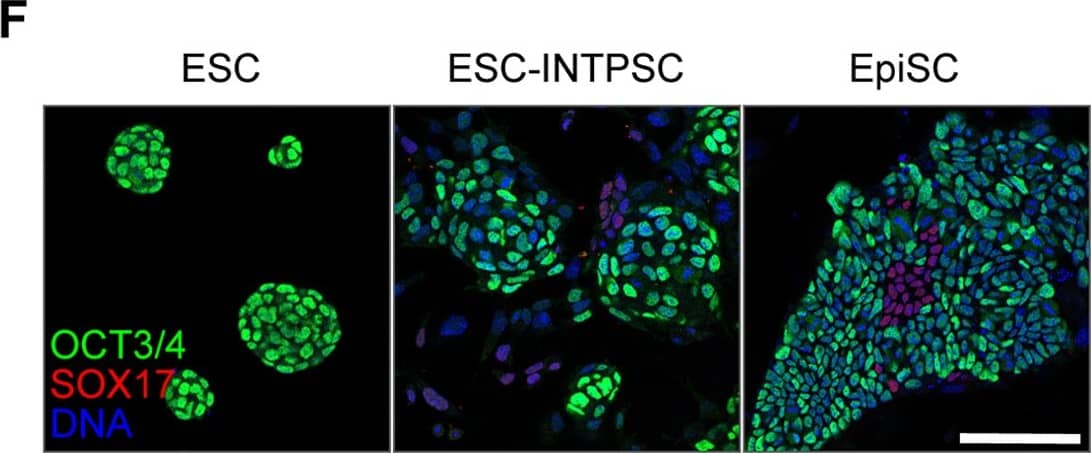
Features of ESC-INTPSCs intermediate between ESCs and EpiSCs.(A) Comparison of gene expression in ESCs, EpiSCs, and ESC-INTPSCs. (B) The number of AP-positive colonies formed in the LIF/2i condition four days after 1000 cells were seeded per dish. (C) Proliferation of ESCs, EpiSCs, and ESC-INTPSCs with or without JAKi. (D) Expression of ESRRB and FOXA2. White arrows indicate ESRRB- and FOXA2-double–positive cells. Scale bar, 100 µm. (E) Percentage of ESRRB-positive or ESRRB- and FOXA2-double–positive cells in ESCs, ESC-INTPSCs, and EpiSCs. (F) Expression of OCT3/4 and SOX17. Scale bar, 100 µm. (G) The number of Oct3/4-GFP–positive or –negative colonies derived from single cells at day 4 and 8. Image collected and cropped by CiteAb from the following publication (https://dx.plos.org/10.1371/journal.pone.0095329), licensed under a CC-BY license. Not internally tested by R&D Systems.
Detection of Mouse SOX17 by Western Blot
Activation of Sox17 at onset of EC regeneration and Sox17-mediated Cyclin E1 expression. a qPCR analysis of gene expression in sorted CD31+ cells from mTmG-Scl mice before and after injury (12 mg/kg i.p.). Sox17, Vegfr2, and Ccne1 increased significantly at day 2 post-LPS compared to baseline. n = 3. Color scale: the fold change increases from red to white to green color. b Western blot analysis in fresh isolated ECs from wild-type mice and quantification c showed a 5-fold increase in Sox17 protein expression within 1 day following injury compared to baseline and followed by recovery within 3 days post-LPS. n = 3. d, e Western blot analysis of cultured HLMVECs in which Sox17 was overexpressed showed 2.5x fold increase in Cyclin E1 protein expression relative to control cells. n = 3. OE, overexpression. f Representation of the CCNE1 promoter region with Sox17 binding sites (circled numbers) and their sequences. g HLMVECs were retrovirally transduced with Sox17 or control plasmid for 3 days, and Ch-IP assay followed by qPCR was performed to amplify Sox17 binding sites in the CCNE1 promoter. n = 3. h 293T cells were transfected with a Sox17 overexpression plasmid containing CCNE1 luciferase reporter constructs. Luciferase values were normalized to Renilla luciferase control reporter values. A schematic representation of corresponding deletion constructs is presented in the right panel. n = 3 and duplicates per sample. **P < 0.01 and ***P < 0.001. Data are shown as mean ± SEM. Analysis was performed using one-way ANOVA for (c) and two-way ANOVA with Bonferroni post-tests for (e, g, h) Image collected and cropped by CiteAb from the following publication (https://pubmed.ncbi.nlm.nih.gov/31073164), licensed under a CC-BY license. Not internally tested by R&D Systems.
Detection of Human SOX17 by Immunocytochemistry/Immunofluorescence
PGCLCs derived from hc-iPSCs.Immunofluorescent staining of (A) BLIMP1 (green color) and (B) OCT4 (green color) in 4-day-old EBs cultured with PGC induction medium on hc-iPSC-1, -2, -5 and -6 (third to fifth column), PBMC derived iPSC0102 and iPSC0207 (right two column). H9 hESCs (left column) adapted in 4i medium was also detected for BLIMP1 and OCT4 antibodies. Noted that there was no BLIMP1 signals detected in undifferentiated H9 in 4i condition. All samples were doubly stained with SOX17 antibody (red color) sequentially. DAPI was used for counterstain (blue). Scale bar = 50μm. (C) Quantification of immunofluoresent staining of PGCLCs. BLIMP1/SOX17 and OCT4/SOX17 double positive cells were counted for PGCLCs and normalized with the number of DAPI. Percentage of PGCLCs per EB of all lines was presented and significance was compared with control hESC H9. ** indicates P<0.005. *** indicates P<0.001. Image collected and cropped by CiteAb from the following publication (https://dx.plos.org/10.1371/journal.pone.0165715), licensed under a CC-BY license. Not internally tested by R&D Systems.
Detection of Mouse SOX17 by Western Blot
soHIF-1 alpha signaling induces Sox17 expression. a MPO activity of flushed lung sample from mice challenged with LPS (12 mg/kg i.p.) for 6 and 24 h. n = 3. b Western blot analysis of wild-type mice lung before and after LPS-induced injury (12 mg/kg i.p.) and its quantification c showed that HIF-1 alpha protein expression increased within 6 h post-LPS and remained increased until day 2. n = 3. d Western blot analysis in freshly isolated ECs from Hif1afl/fl mice and quantification e showed significantly increased Sox17 protein expression after injury when compared to baseline levels. n = 3. f Western blot analysis in freshly isolated ECs from Hif1aEC−/− mice and quantification g showed no significant difference in Sox17 protein expression before and after injury. n = 3. **P < 0.01 and ***P < 0.001. Data are shown as mean ± SEM. Analysis was performed using one-way ANOVA for (b, c, e, g) Image collected and cropped by CiteAb from the following publication (https://pubmed.ncbi.nlm.nih.gov/31073164), licensed under a CC-BY license. Not internally tested by R&D Systems.
Detection of Mouse SOX17 by Western Blot
EC specific deletion of Sox17 (Sox17EC−/−) in mice prevents endothelial regeneration. a Schematic diagram of Sox17fl/fl mice crossed with Scl-CreERT2 to delete Sox17 in ECs. After tamoxifen feeding for five days and rest for another four weeks, mice are challenged with LPS (sub-lethal 8 mg/kg, i.p.) for analysis. b Western blot analysis of Sox17 protein expression in isolated ECs obtained from flushed lungs of Sox17EC−/− and control mice. n = 4. c Quantification of b shows 80% deletion of Sox17 in ECs of Sox17EC−/− mice compared to control mice. n = 4. d Time course of lung transvascular permeability following LPS challenge in Sox17EC−/− and Sox17fl/fl mice. n = 4. While control mouse lungs showed increased endothelial permeability at day 1 post-LPS and then recovered to baseline by day 5, Sox17EC−/− mice showed prolonged endothelial barrier leakiness post-LPS. e Time course of changes in lung transvascular permeability following LPS challenge was also carried out in Sox17fl/fl mice crossed with Cdh5-CreERT2 mice. n = 4. Similar as in d, these Sox17EC−/− mice also showed persistent leakiness post-LPS while control mice fully recovered. f Survival curve of LPS challenge in Sox17EC−/− and control mice. n = 8 per group. At this sub-lethal dose, all control mice survived whereas half of Sox17EC−/− mice died on day 2 post-LPS with increased mortality on day 3. By day 5, the death rate for control mice is 0 while for Sox17EC−/− mice is 60%. g Flow cytometry analysis of CD31+CD45− ECs among whole lung population in mice following injury. n = 4. In contrast to control mice in which CD31+CD45− EC population gradually recovered with day 3 post-LPS after initial loss of ECs, Sox17EC−/− mice showed significantly delayed restoration of ECs post-LPS period. h Quantification of BrdU+ nuclei in each field of 425 μm2 area in flushed lung cryo-sections from mice following injury. n = 4 mice per group and 6 replicates per sample. Slides are co-stained with CD31-AF488, BrdU-APC, and DAPI. At day 3 post-LPS, the control group showed a significantly higher number of BrdU+ECs compared to baseline. However, Sox17EC−/− mice showed markedly reduced level of BrdU+ECs, indicating reduced EC proliferation. i To assess whether expression of Sox17 in ECs can restore lung endothelial integrity, studies were performed in Sox17EC−/− mice to overexpress Sox17 protein. We used a mixture of 50 μg plasmid (mouse Cdh5 promoter—Flag —Sox17) encapsulated in liposomes, which were injected i.v. 3 h after LPS challenge. j At day 3 post-LPS, liposome vector-treated Sox17EC−/− mice showed marked EC barrier leakiness as assessed by lung transvascular permeability of albumin whereas the Sox17-rescued mice showed markedly reduced endothelial permeability. n = 4. OE, overexpression. *P < 0.05, **P < 0.01 and ***P < 0.001. Data are shown as mean ± SEM. Analysis was performed using two-tailed Student’s t-test for (c, j), two-way ANOVA with Bonferroni post-tests for (d, e, g, h) and Log-rank (Mantel-Cox) test for (f) Image collected and cropped by CiteAb from the following publication (https://pubmed.ncbi.nlm.nih.gov/31073164), licensed under a CC-BY license. Not internally tested by R&D Systems.
Detection of Mouse SOX17 by Immunocytochemistry/Immunofluorescence
p38-Mapk14/11 inhibition during blastocyst maturation blocks PrE differentiation/maturation. (a) Experimental schema of p38-Mapk14/11 inhibition (+SB220025), plus vehicle control (+DMSO), and the details of antibodies used to analyse ICM cell lineage marker protein expression by immunofluorescence (IF) in late blastocysts (E4.5); Nanog and Gata4 (+DMSO n = 27, +SB220025 n = 33)—green, Nanog and Sox17 (+DMSO n = 18, +SB220025 n = 20)—red, and Nanog and Gata6 (+DMSO n = 24, +SB220025 n = 27)—blue. (b) Representative single confocal z-plane micrographs of vehicle control-treated (+DMSO) or p38-Mapk14/11 inhibited (+SB220025) late-blastocyst stage/equivalent embryos, immunofluorescently stained for indicated ICM cell lineage markers (Nanog in green and Gata4, Sox17 and Gata6 in red, plus DAPI DNA stain in blue). Examples of cells classified as TE, PrE and EPI are marked with an asterisk, arrowhead and arrow, respectively. Scale bar, 15 µm. (c) Pie charts of the relative cell lineage contribution in vehicle control (+DMSO) and p38-Mapk14/11 inhibited (+SB220025) blastocysts as judged by IF to detect the stated ICM lineage marker proteins. Blue, trophectoderm (TE); yellow, epiblast (EPI—ICM exhibiting exclusive Nanog expression); green, primitive endoderm (PrE—ICM exhibiting exclusive Gata4/6 or Sox17 expression, as appropriate); orange, uncommitted ICM cells (exhibiting co-expression of both Nanog and Gata4/6 or Sox17, as appropriate); and grey, ICM cells negative for either assayed marker. (d) Bar charts show average number of cells allocated to each specified ICM lineage, as judged by the indicated IF staining regime employed. Error bars represent s.e.m. and asterisks denote statistical significant differences in cell number between the vehicle control (+DMSO, black bars) and p38-Mapk14/11 inhibited (+SB220025, grey bars) embryo groups, according to two-tailed Student's t-test, with *p < 0.05 and **p < 0.005 confidence intervals. Yellow asterisk denotes increase in cells positively immunofluorescently staining for both EPI and PrE ICM markers using anti-Nanog and anti-Gata6 (an early PrE marker) antibodies. All individual embryo data used in the preparation of this figure are contained within the electronic supplementary material, table S3. Image collected and cropped by CiteAb from the following publication (https://pubmed.ncbi.nlm.nih.gov/27605380), licensed under a CC-BY license. Not internally tested by R&D Systems.
Detection of Human SOX17 by Immunocytochemistry/Immunofluorescence
Differentiation of hESCs into definitive endoderm cells by Activin A with CHIR99021.a The relative primitive streak (BRACHYRUY, MESP1, and MIXL1) gene expression of the day 1 differentiated cells by adding Activin A (100 ng/mL) with CHIR99021 (2–5 µM) or Wnt3a (25–100 ng/mL) treatments were determined by real-time quantitative PCR (qPCR). None, no WNT signaling pathway activators were used on day 1 for PS differentiation (Activin A only). b, c After 1 day, the medium was changed to Activin A (100 ng/mL) and 1 × CTS-B27 to induce DE differentiation. The definitive endoderm (FOXA2 and SOX17) and mesoderm (MESP2 and HAND1) relative gene expression levels were determined by qPCR. d Immunofluorescence analysis of the expression of SOX17 and FoxA2 for Activin A with 2 µM CHIR99021-induced differentiated cells on day 3. e, f The expression of SOX17 and FoxA2 for Activin A with 2 µM CHIR99021-induced differentiated cells was determined by flow cytometry on day 3. Isotype control antibodies were used as controls. At a specific gene expression, datum points lacking common letters differ, p < 0.05. Data are represented as the mean ± SD. Scale bar, 100 µm Image collected and cropped by CiteAb from the following publication (https://pubmed.ncbi.nlm.nih.gov/31601782), licensed under a CC-BY license. Not internally tested by R&D Systems.
Detection of Mouse SOX17 by Western Blot
HIF-1 alpha activates transcription of Sox17. a Western blot analysis in control HLMVECs and HLMVECs for which CRISPR/Cas9 was used to delete HIFs. ECs were treated with the HIF prolyl hydroxylase inhibitor DMOG to induce HIF expression. DMOG (1 mM) increased HIF-1 alpha and HIF-2 alpha protein expression in control ECs but not in ECs lacking HIF-1 alpha or HIF-2 alpha. Induction of HIF expression was coupled to Sox17 upregulation. n = 3. b Quantification of a showed that protein expression of HIF-1 alpha and HIF-2 alpha in ECs was significantly increased by DMOG treatment. Sox17 showed a 2.5-fold increase in Sox17 expression control DMSO treated ECs. The increase in Sox17 was significantly reduced in HIF-1 alpha-deleted ECs but preserved in HIF-2 alpha-deleted ECs, indicating the importance of HIF-1 alpha in mediating Sox17 expression. n = 3. c Representation of the SOX17 promoter region with 3 HREs indicated by circled numbers, and their respective sequences are displayed. d HLMVECs were exposed to normoxia or 1% O2 (hypoxia) for 8 h. Ch-IP assay followed by qPCR was performed to amplify the HRE regions in the SOX17 promoter. Studies were performed in ECs exposed to either normoxia or hypoxia. n = 3. e 293T cells were transfected with a HIF-1 alpha overexpression plasmid containing SOX17 luciferase reporter constructs. Luciferase values were normalized to Renilla luciferase control reporter values. A schematic representation of corresponding deletion constructs is presented in the right panel. n = 3 and duplicates per sample. Results show that hypoxia activation of SOX17 HRE3 was required for Sox17 expression. **P < 0.01 and ***P < 0.001. Data are shown as mean ± SEM. Analysis was performed using two-way ANOVA with Bonferroni post-tests for (b, d, e) Image collected and cropped by CiteAb from the following publication (https://pubmed.ncbi.nlm.nih.gov/31073164), licensed under a CC-BY license. Not internally tested by R&D Systems.
Detection of Human SOX17 by Immunocytochemistry/Immunofluorescence
Concordant expression of developmental programs across organoids from four human iPSC lines. a Heatmap of expression patterns for major nephrogenesis markers across organoid differentiation time points (iPSC D0, D7, D15, and D29, averaged across four cell lines, ML protocol) and human adult kidney. Expression values were row-normalized to obtain z-scores; red color indicates positive z-scores. b Canonical (NPHS2) and data-derived (CLDN5) podocyte marker genes superimposed in tSNE plots from D15 organoids (N2 line, ML protocol). c IF staining of D15 kidney organoid (N2 line, ML protocol) for CLDN5 as a marker of early podocyte differentiation derived from the single-cell data. Additional canonical podocyte markers (NPHS1, WT1) and DAPI staining as shown. d IF staining of D29 kidney organoid (AS line, ML protocol) for SOX17 and CD31, markers of endothelial cells. Image collected and cropped by CiteAb from the following publication (https://pubmed.ncbi.nlm.nih.gov/31784515), licensed under a CC-BY license. Not internally tested by R&D Systems.
Detection of Mouse Human SOX17 Antibody by Immunocytochemistry/ Immunofluorescence
Characterization of hybrid cells.(A) Both ES-pNSC and pES-NSC hybrid cells are positive for alkaline phosphatase staining (100 ×). (B) RT-PCR analysis of Oct4, Nanog, Sox2, and Nestin expression in fusion partner and reprogrammed hybrid cells. Pluripotency markers, Oct4 and Nanog, which were not expressed in NSCs and pNSCs were expressed in GFP+ fusion hybrid cells. On the other hand, Nestin, which was expressed in NSCs and pNSCs was silenced after forming GFP+ fusion hybrid cells. (C) Immunocytochemistry analysis of Oct4 and Nanog in ES-pNSC and pES-NSC hybrid cells (100 ×). (D)In vitro differentiation of ES-pNSC and pES-NSC hybrid cells into ectoderm (Tuj1), mesoderm (SMA), and endoderm (Sox17) lineages (200 ×). (E) In vivo differentiation potential of ES-pNSC and pES-NSC hybrid cells through teratoma assay. These hybrid cells were contributed to secretory epithelium (ectoderm), cartilage (mesoderm) and gut epithelium (endoderm), which were stained with PAS, Asian blue, and hematoxylin eosin, respectively. Each tissue was indicated by arrow head. Image collected and cropped by CiteAb from the following publication (https://pubmed.ncbi.nlm.nih.gov/27232503), licensed under a CC-BY license. Not internally tested by R&D Systems.
Detection of Human Human SOX17 Antibody by Western Blot
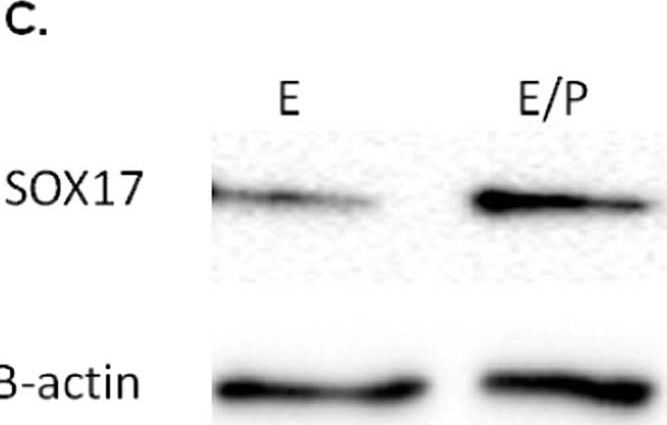
Localisation of Sox17 staining in proliferative and secretory phase endometrial tissue and regulation by hormones. Within the proliferative (A) and secretory (B) endometrium, Sox17 localized to the glandular (open arrowheads) and luminal (closed arrowheads) epithelium, with staining appearing in an irregular, patchy, pattern. Smaller inset boxes show relevant IgG negative controls. Imaged at 20x magnification, scale bar = 50 μm. Treatment of endometrial luminal epithelial (ECC-1) cells with 10−8 M estrogen (estradiol)/10−7 M progesterone (medroxyprogesterone acetate) (, *p < 0.05) resulted in an upregulation of Sox17 protein, when compared to untreated, estradiol only (■, E) treatment groups. (C,D) Data presented as mean ± SEM, n = 5. Representative Western immunoblot shown. Image collected and cropped by CiteAb from the following publication (https://pubmed.ncbi.nlm.nih.gov/31664088), licensed under a CC-BY license. Not internally tested by R&D Systems.
Detection of Human Human SOX17 Antibody by Western Blot
Knockdown of SOX17 results in reduced expression in endometrial luminal epithelial cells. Transfection of ECC-1 cells with a CRISPR/Cas9 SOX17 knock down plasmid resulted in decreased SOX17 expression (KD1-5) when compared to untransfected control ECC-1 cells (ECC-1) and ECC-1 cells transfected with a control plasmid (CP). Analysed by Western immunoblot, representative blot shown. Image collected and cropped by CiteAb from the following publication (https://pubmed.ncbi.nlm.nih.gov/31664088), licensed under a CC-BY license. Not internally tested by R&D Systems.


