Mouse ICAM-1/CD54 Antibody
R&D Systems, part of Bio-Techne | Catalog # AF796


Key Product Details
Validated by
Species Reactivity
Validated:
Cited:
Applications
Validated:
Cited:
Label
Antibody Source
Product Specifications
Immunogen
Gln28-Asn485
Accession # Q3U8M7
Specificity
Clonality
Host
Isotype
Endotoxin Level
Scientific Data Images for Mouse ICAM-1/CD54 Antibody
ICAM‑1/CD54 in Mouse Testis.
ICAM-1/CD54 was detected in perfusion fixed frozen sections of mouse testis using Goat Anti-Mouse ICAM-1/CD54 Antigen Affinity-purified Polyclonal Antibody (Catalog # AF796) at 15 µg/mL overnight at 4 °C. Tissue was stained using the Anti-Goat HRP-DAB Cell & Tissue Staining Kit (brown; Catalog # CTS008) and counterstained with hematoxylin (blue). Specific staining was localized to plasma membrane in Leydig cells. View our protocol for Chromogenic IHC Staining of Frozen Tissue Sections.Detection of Mouse ICAM-1/CD54 by Western Blot
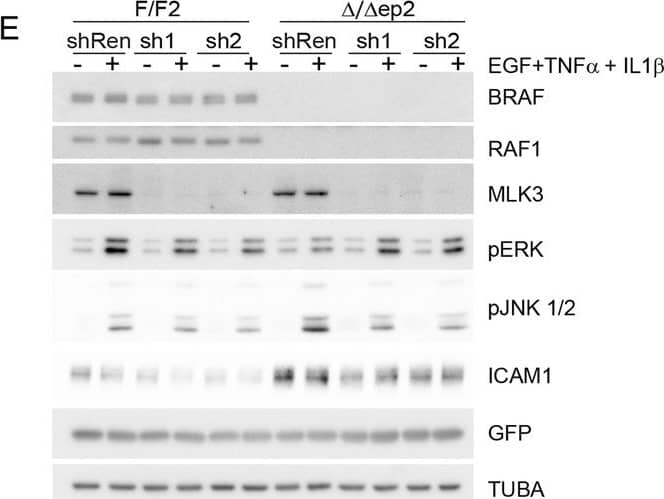
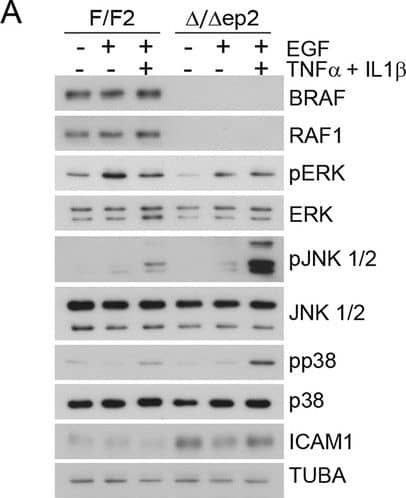
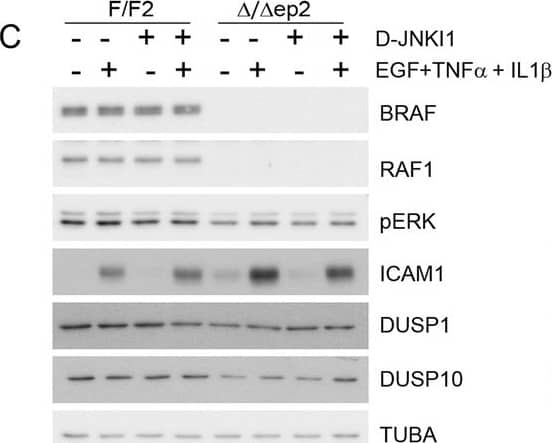
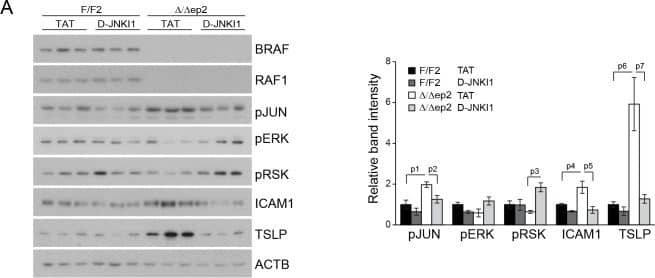
Increased stress kinase signaling and JNK pathway-dependent cytokine and chemokine production by primary keratinocytes lacking BRAF and RAF1.(A) Reduced ERK phosphorylation and increased JNK/p38 activation in primary delta/ deltaep2 keratinocytes stimulated with EGF and/or TNF alpha and IL1 beta for 15 min. (B) Increased cytokine and chemokine production in primary delta/ deltaep2 keratinocytes treated with EGF, TNF alpha and IL1 beta for 24 hr. Cytokine and chemokine production was determined by multiplex analysis, except for TSLP which was quantified by ELISA. Data represent mean ± SEM of 3–5 biological replicates. (C–D) Cells were pretreated with D-JNKI1 inhibitors prior to stimulation with EGF, TNF alpha and IL1 beta for 15 min (C) or 24 hr (D). Data represent the mean ± SEM of technical replicates (n = 3). (E–F) Effect of shRNA-mediated Mlk3 silencing on ERK and JNK phosphorylation and ICAM1 expression (E; stimulation with EGF, TNF alpha and IL1 beta for 15 min) and on the expression of Ccl2 and Tslp mRNA (F; stimulation with EGF, TNF alpha and IL1 beta for 24 hr) by F/F2 and delta/ deltaep2 keratinocytes. shRen, shRNA targeting Renilla, used as a control; sh1 and sh2, targeting Mlk3, binding sites nucleotide 2266–2285 and 2383–2402, respectively. The shRNAs were encoded by lentiviral vectors coexpressing GFP. GFP immunoblots are shown to confirm similar levels of infection in all samples. Data represent mean ± SEM of 4 biological replicates. Each keratinocyte culture represents a pool of three mice. Immunoblots are representative of three independent experiments. p1 = 0.041, p2 = 0.040, p3 = 1.89E-4, p4 = 0.018, p5 = 0.046, p6 = 0.020, p7 = 0.008, p8 = 0.016, p9 = 0.001, p10 = 0.018, p11 = 3.23E-4, p12 = 1.47E-4, p13 = 0.007, p14 = 0.03, p15 = 0.035, p16 = 0.023 and p17 = 0.046.DOI:https://dx.doi.org/10.7554/eLife.14012.018Compound knockdown (KD2) of BRAF and RAF1 induce the expression of inflammation markers by HaCat cells in a MLK3/JNK-dependent manner.(A) Reduced ERK and increased JNK/p38 activation in BRAF and RAF1 knockdown (KD2) HaCat cells stimulated with EGF, TNF alpha and IL1 beta for 15 min. (B) D-JNKI1 reduces ICAM1 and CCL2 (n = 4) expression in KD2 cells treated with TNF alpha. (C) MEKi induces ICAM1 and CCL2 (n = 3) expression in RAF1KD cells treated with TNF alpha. In (B–C), ICAM1 expression was measured after a 3 hr, CCL2 expression after a 24 hr treatment with TNF alpha. (D) Effect of MLK3 silencing on ERK and JNK phosphorylation in WT and KD2 cells stimulated as in (A). MLK3 was silenced using a pool of oligonucleotides targeting the following regions: 686–704; 1489–1507; 2122–2138; and 2348–2366. MLK3 KD cells stimulated as in (B–C) show a decrease in JNK activation, ICAM1 and CCL2 (n = 7) expression. Immunoblots are representative of three independent experiments. qPCR data represent mean ± SEM of three independent experiments run in duplicates (p1 = 4.62E-4, p2 = 0.013, p3 = 0.050, p4 = 8.60E-8, p5 = 0.050, p6 = 0.001, p7 = 0.001 and p8 = 0.012).DOI:https://dx.doi.org/10.7554/eLife.14012.019 Image collected and cropped by CiteAb from the following publication (https://elifesciences.org/articles/14012), licensed under a CC-BY license. Not internally tested by R&D Systems.Detection of Mouse ICAM-1/CD54 by Western Blot
Increased stress kinase signaling and JNK pathway-dependent cytokine and chemokine production by primary keratinocytes lacking BRAF and RAF1.(A) Reduced ERK phosphorylation and increased JNK/p38 activation in primary delta/ deltaep2 keratinocytes stimulated with EGF and/or TNF alpha and IL1 beta for 15 min. (B) Increased cytokine and chemokine production in primary delta/ deltaep2 keratinocytes treated with EGF, TNF alpha and IL1 beta for 24 hr. Cytokine and chemokine production was determined by multiplex analysis, except for TSLP which was quantified by ELISA. Data represent mean ± SEM of 3–5 biological replicates. (C–D) Cells were pretreated with D-JNKI1 inhibitors prior to stimulation with EGF, TNF alpha and IL1 beta for 15 min (C) or 24 hr (D). Data represent the mean ± SEM of technical replicates (n = 3). (E–F) Effect of shRNA-mediated Mlk3 silencing on ERK and JNK phosphorylation and ICAM1 expression (E; stimulation with EGF, TNF alpha and IL1 beta for 15 min) and on the expression of Ccl2 and Tslp mRNA (F; stimulation with EGF, TNF alpha and IL1 beta for 24 hr) by F/F2 and delta/ deltaep2 keratinocytes. shRen, shRNA targeting Renilla, used as a control; sh1 and sh2, targeting Mlk3, binding sites nucleotide 2266–2285 and 2383–2402, respectively. The shRNAs were encoded by lentiviral vectors coexpressing GFP. GFP immunoblots are shown to confirm similar levels of infection in all samples. Data represent mean ± SEM of 4 biological replicates. Each keratinocyte culture represents a pool of three mice. Immunoblots are representative of three independent experiments. p1 = 0.041, p2 = 0.040, p3 = 1.89E-4, p4 = 0.018, p5 = 0.046, p6 = 0.020, p7 = 0.008, p8 = 0.016, p9 = 0.001, p10 = 0.018, p11 = 3.23E-4, p12 = 1.47E-4, p13 = 0.007, p14 = 0.03, p15 = 0.035, p16 = 0.023 and p17 = 0.046.DOI:https://dx.doi.org/10.7554/eLife.14012.018Compound knockdown (KD2) of BRAF and RAF1 induce the expression of inflammation markers by HaCat cells in a MLK3/JNK-dependent manner.(A) Reduced ERK and increased JNK/p38 activation in BRAF and RAF1 knockdown (KD2) HaCat cells stimulated with EGF, TNF alpha and IL1 beta for 15 min. (B) D-JNKI1 reduces ICAM1 and CCL2 (n = 4) expression in KD2 cells treated with TNF alpha. (C) MEKi induces ICAM1 and CCL2 (n = 3) expression in RAF1KD cells treated with TNF alpha. In (B–C), ICAM1 expression was measured after a 3 hr, CCL2 expression after a 24 hr treatment with TNF alpha. (D) Effect of MLK3 silencing on ERK and JNK phosphorylation in WT and KD2 cells stimulated as in (A). MLK3 was silenced using a pool of oligonucleotides targeting the following regions: 686–704; 1489–1507; 2122–2138; and 2348–2366. MLK3 KD cells stimulated as in (B–C) show a decrease in JNK activation, ICAM1 and CCL2 (n = 7) expression. Immunoblots are representative of three independent experiments. qPCR data represent mean ± SEM of three independent experiments run in duplicates (p1 = 4.62E-4, p2 = 0.013, p3 = 0.050, p4 = 8.60E-8, p5 = 0.050, p6 = 0.001, p7 = 0.001 and p8 = 0.012).DOI:https://dx.doi.org/10.7554/eLife.14012.019 Image collected and cropped by CiteAb from the following publication (https://elifesciences.org/articles/14012), licensed under a CC-BY license. Not internally tested by R&D Systems.Applications for Mouse ICAM-1/CD54 Antibody
Adhesion Blockade
Immunohistochemistry
Sample: Perfusion fixed frozen sections of mouse testis
Western Blot
Sample: Recombinant Mouse ICAM-1/CD54 Fc Chimera (Catalog # 796-IC)
Reviewed Applications
Read 8 reviews rated 4.5 using AF796 in the following applications:
Formulation, Preparation, and Storage
Purification
Reconstitution
Formulation
Shipping
Stability & Storage
- 12 months from date of receipt, -20 to -70 °C as supplied.
- 1 month, 2 to 8 °C under sterile conditions after reconstitution.
- 6 months, -20 to -70 °C under sterile conditions after reconstitution.
Background: ICAM-1/CD54
Intercellular Adhesion Molecule-1 (ICAM-1, CD54) binds the leukocyte integrins LFA-1 and Mac-1. ICAM-1 expression is weak on leukocytes, epithelial and resting endothelial cells, as well as some other cell types, but expression can be stimulated by IFN-gamma, TNF-alpha, IL-1 beta, and LPS. Mouse and human ICAM-1 share approximately 54% amino acid identity.
Soluble ICAM-1 is found in a biologically active form in serum, probably as a result of proteolytic cleavage from the cell surface, and is elevated in patients with various inflammatory syndromes such as septic shock, leukocyte adhesion deficiency syndrome (LAD), cancer, and transplantation.
References
- Pigott, R. and C. Power (1993) in The Adhesion Molecule Facts Book. Academic Press, p. 74.
- Siu, G. et al. (1989) J. Immunol. 143:3813.
- Ballantyne, C.M. et al. (1989) Nuc. Acid. Res. 17:5853.
Long Name
Alternate Names
Gene Symbol
UniProt
Additional ICAM-1/CD54 Products
Product Documents for Mouse ICAM-1/CD54 Antibody
Product Specific Notices for Mouse ICAM-1/CD54 Antibody
For research use only
