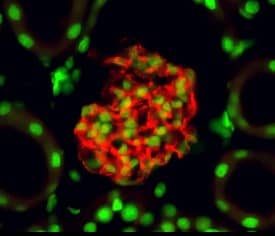
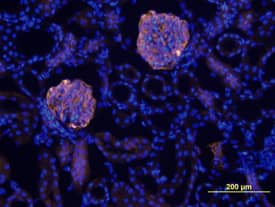
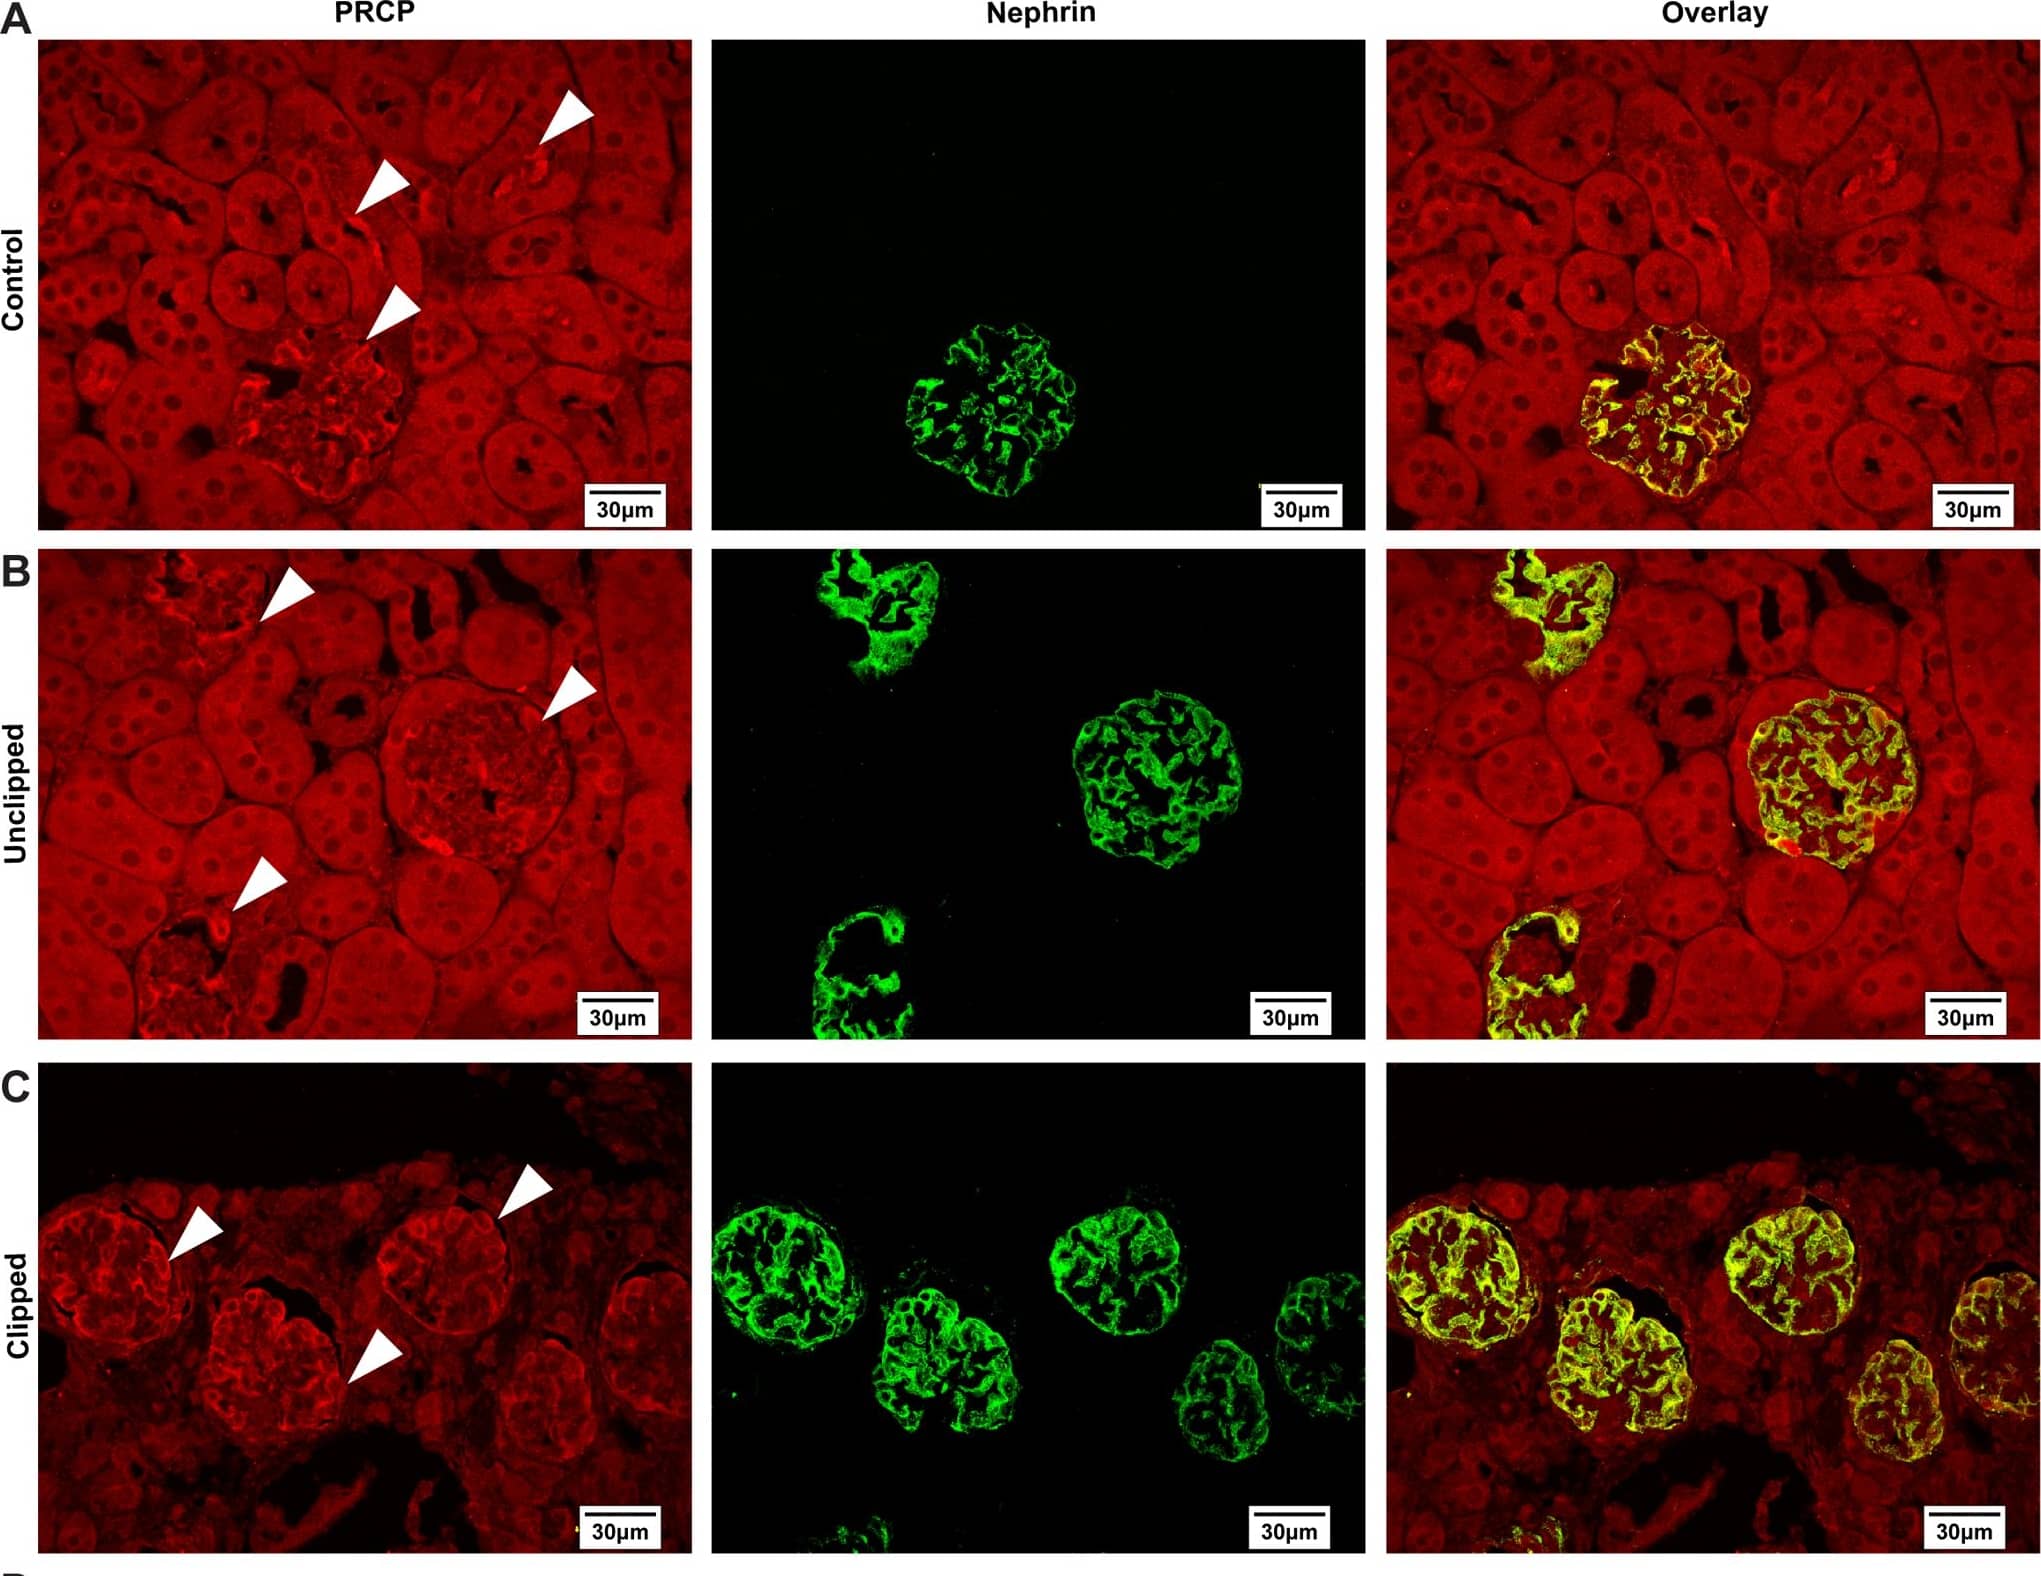
Detection of Mouse Nephrin by Immunocytochemistry/Immunofluorescence
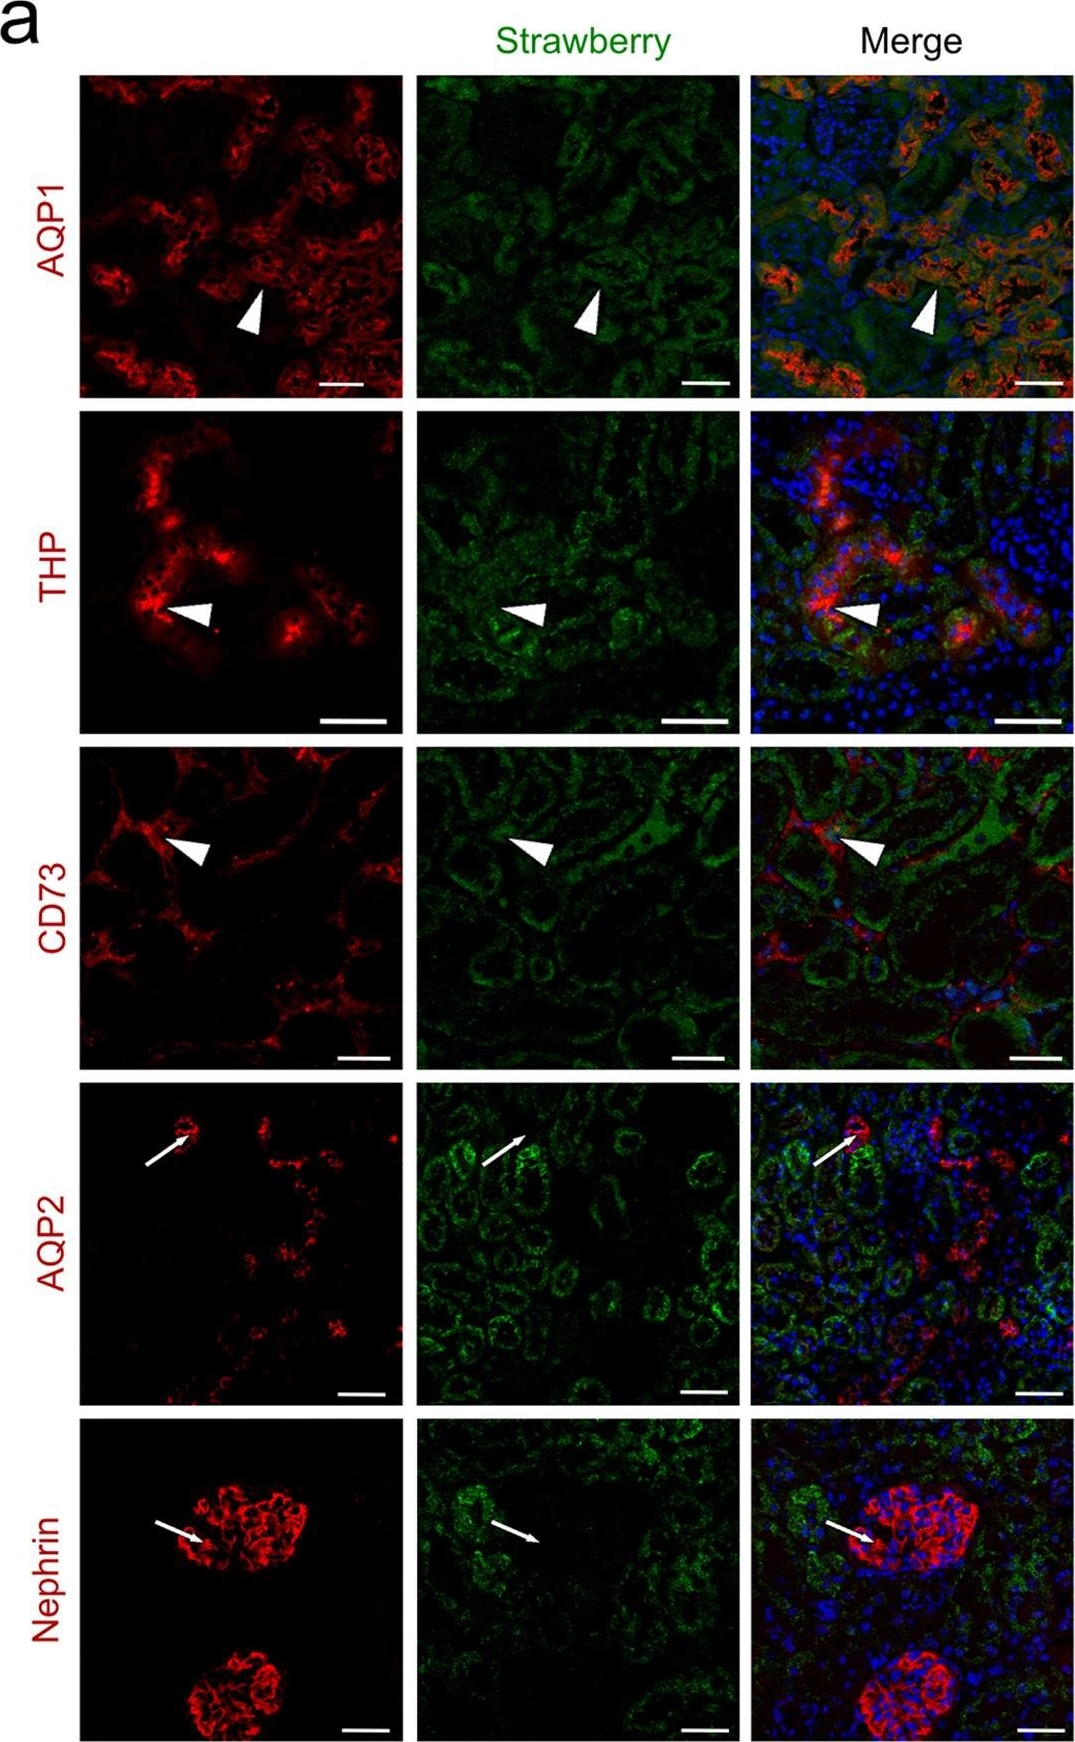
Intraparenchymal delivery of lentiviral vectors preferentially infects epithelial cells of both kidneys and urinary bladder.(a) Confocal images of Strawberry expression in renal sections of ELS infected kidneys 60 days post injection. Sections were stained with the indicated antibodies and merged images with DAPI (blue) are presented. Preferential transduction was observed in proximal (AQP1) and distal (THP) renal tubular epithelial cells and renal fibroblasts (CD73) (white arrowheads). Strawberry was not localised to collecting ducts (AQP2) or podocytes (Nephrin) (white arrows). Scale bars, 50 μm. (b) Confocal images of Strawberry expression in the liver, spleen, lung, urinary bladder and left and right kidney of ELS infected animals 60 days post left intrarenal injection (top panels) and uninjected control animals (bottom panels). Sections were stained with an antibody against Strawberry (green) and merged images with DAPI (blue) are presented. Scale bars, 50 μm. Image collected and cropped by CiteAb from the following publication (https://pubmed.ncbi.nlm.nih.gov/26046460), licensed under a CC-BY license. Not internally tested by R&D Systems.
Detection of Mouse Nephrin by Immunocytochemistry/Immunofluorescence
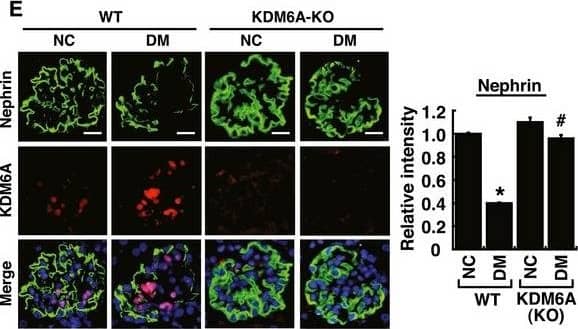
Podocyte‐specific knockout of KDM6A in mice protects against diabetes‐induced kidney injuryAQuantitative RT–PCR evaluation of KDM6A mRNA expression in kidney glomeruli isolated from wild‐type and KDM6A‐knockout (KO) mice. *P < 0.05, significant difference versus wild‐type controls (Wilcoxon two‐sample test; n = 8).BWestern blot analysis of KDM6A expression in glomeruli and podocytes isolated from wild‐type and KDM6A‐KO mice. Presented experiments were performed at least three times independently.CChanges in body weights and levels of blood glucose in wild‐type or KDM6A‐KO mice with or without STZ treatment. No significant differences in body weights or blood glucose levels between wild‐type and KDM6A‐KO mice with diabetes were observed during the 8‐week experimental period (Wilcoxon two‐sample test; n = 8).DLevels of urinary protein excretion, weights of kidney, and levels of HbA1c in wild‐type and KDM6A‐KO mice with or without STZ treatment (at 8 weeks after the onset of diabetes). The mean relative kidney weight (%) shown in the study is determined as the percent of kidneys out of total body weight, and the HbA1c level is defined as the ratio of HbA1c to the total hemoglobin (% HbA1c; DCCT unit). *P < 0.05 versus untreated wild‐type controls, #P < 0.05 versus STZ‐treated wild‐type mice (parametric ANOVA and a Bonferroni post hoc test; n = 8).EImmunofluorescence images of kidney sections stained with KDM6A and nephrin in wild‐type (WT‐NC), KDM6A‐KO (KO‐NC), STZ‐treated wild‐type (WT‐DM), or STZ‐treated KDM6A‐KO (KO‐DM) mice. Scale bars, 20 μm. *P < 0.05 versus untreated wild‐type controls, #P < 0.05 versus STZ‐treated wild‐type mice (parametric ANOVA and a Bonferroni post hoc test; n = 3).FImmunofluorescence images of kidney sections stained with KDM6A and H3K27me3 in wild‐type (WT‐NC), KDM6A‐KO (KO‐NC), STZ‐treated wild‐type (WT‐DM), or STZ‐treated KDM6A‐KO (KO‐DM) mice. Scale bars, 20 μm. *P < 0.05 versus untreated wild‐type controls, #P < 0.05 versus STZ‐treated wild‐type mice (parametric ANOVA and a Bonferroni post hoc test; n = 3).GImmunofluorescence staining of F‐actin and KDM6A in primary podocytes isolated from the above‐treated mice. Presented experiments were performed at least three times independently. Scale bars, 20 μm.HWestern blot analysis of nephrin, KDM6A, and WT‐1 expressed in primary podocytes isolated from the above‐treated mice. *P < 0.05 versus untreated wild‐type controls, #P < 0.05 versus STZ‐treated wild‐type mice (parametric ANOVA and a Bonferroni post hoc test; n = 3).IEffect of high glucose on the expression of podocyte‐related markers in primary cultured podocytes isolated from wild‐type or KDM6A‐KO mice. The primary podocytes isolated from wild‐type or KDM6A‐KO mice were cultured in normal or high glucose (30 mM) for 48 h. Protein lysates from the cultured podocytes were subjected to Western blot analysis with the indicated antibodies. *P < 0.05 versus wild‐type podocytes in normal glucose, #P < 0.05 versus wild‐type podocytes in high glucose (parametric ANOVA and a Bonferroni post hoc test; n = 3).Data information: Data are expressed as mean ± SEM. See the exact P‐values for comparison tests in Appendix Table S4. Image collected and cropped by CiteAb from the following publication (https://pubmed.ncbi.nlm.nih.gov/30948420), licensed under a CC-BY license. Not internally tested by R&D Systems.
Detection of Mouse Nephrin by Immunocytochemistry/Immunofluorescence
KLF10 is a downstream effector of KDM6A and is capable of directly binding to nephrin gene promoterAScreening of the potential KDM6A‐regulated transcriptional factors involved in repression of nephrin expression. After transduction with a control lentiviral vector or a lentiviral vector expressing KDM6A into primary podocytes for 48 h, intracellular RNAs were isolated and used for RNA sequencing (RNA‐Seq) analysis. The transcript expression patterns of 86 selected transcriptional factors from three independent RNA‐Seq experiments are presented in a heat map. Notably, among these 86 selected genes, KLF10 is the most up‐regulated gene.BValidation of increased KDM6A and KLF10 expression in primary podocytes that were infected with an empty lentiviral vector or KDM6A‐expressing lentiviral vector for 48 h. *P < 0.05 versus the empty vector control (Wilcoxon two‐sample test; n = 3).CIncreased expression of KDM6A and KLF10 in primary podocytes cultured in high glucose for 48 h. *P < 0.05 versus normal controls (Wilcoxon two‐sample test; n = 3).DEffect of KLF10 knockdown on high glucose‐mediated reduction of nephrin in primary podocytes. As noted, knockdown of KLF10 prevented down‐regulation of nephrin and up‐regulation of KDM6A in high glucose‐treated podocytes. *P < 0.05 versus normal controls, #P < 0.05 versus control siRNA with HG incubation (parametric ANOVA and a Bonferroni post hoc test; n = 3).EImmunofluorescence analysis of KLF10 and nephrin in renal sections of normal, diabetic, and GSK‐J4‐treated diabetic mice. Scale bars, 20 μm. *P < 0.05 versus the normal control group, #P < 0.05 versus the untreated diabetic group (parametric ANOVA and a Bonferroni post hoc test; n = 3).FImmunofluorescence images of KLF10 and nephrin in renal sections of wild‐type or KDM6A‐KO mice with or without STZ treatment. Scale bars, 20 μm. *P < 0.05 versus the untreated wild‐type group, #P < 0.05 versus the STZ‐treated wild‐type group (parametric ANOVA and a Bonferroni post hoc test; n = 3).GWestern blot analysis of KDM6A, KFL10, and nephrin expression in primary podocytes isolated from normal, diabetic, and GSK‐J4‐treated diabetic mice. *P < 0.05 versus normal controls, #P < 0.05 versus the untreated diabetic group (parametric ANOVA and a Bonferroni post hoc test; n = 3).HWestern blot analysis of KDM6A, KLF10, and nephrin expression in primary podocytes isolated from wild‐type or KDM6A‐KO mice with or without STZ treatment. *P < 0.05 versus the untreated wild‐type group, #P < 0.05 versus the STZ‐treated wild‐type group (parametric ANOVA and a Bonferroni post hoc test; n = 3).IChIP analysis of KLF10, acetyl‐histone H4 (H4‐Ac), Dnmt1 and Dnmt3 binding to nephrin gene promoter. ChIP assays were carried out using cross‐linked chromatin from primary podocytes that were cultured in normal or high glucose conditions. *P < 0.05, significant difference versus the normal control group (Wilcoxon two‐sample test; n = 3).JModulation of podocyte‐specific marker expression in primary podocytes by KLF10 overexpression. Ectopic overexpression of KLF10 in primary podocytes significantly repressed various podocyte‐specific markers, but conversely increased KDM6A expression. *P < 0.05 versus the empty vector control (Wilcoxon two‐sample test; n = 3).Data information: Data are expressed as mean ± SEM. See the exact P‐values for comparison tests in Appendix Table S5. Image collected and cropped by CiteAb from the following publication (https://pubmed.ncbi.nlm.nih.gov/30948420), licensed under a CC-BY license. Not internally tested by R&D Systems.
Detection of Mouse Nephrin by Immunocytochemistry/Immunofluorescence
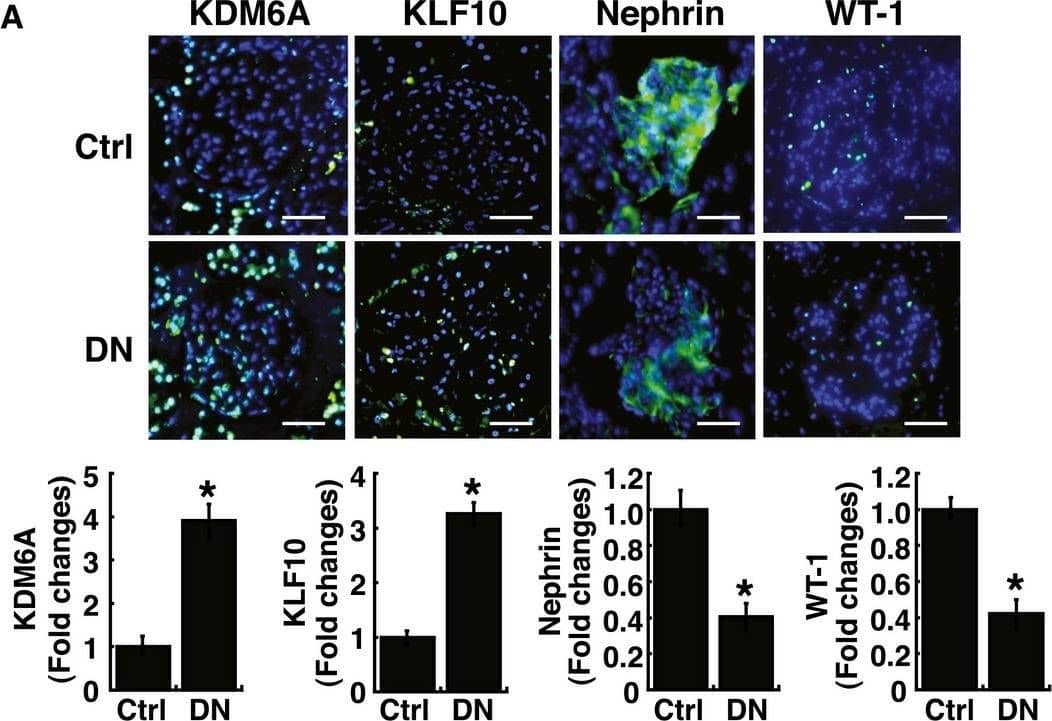
Elevated levels of KDM6A and KLF10 expression, along with decreased levels of nephrin (or WT‐1) expression, are detected in kidney tissues and urinary exosomes of patients with diabetic nephropathyAImmunofluorescence analysis of kidney sections from diabetic nephropathy subjects and non‐diabetic controls stained with KDM6A, KLF10, nephrin, and WT‐1. Scale bars, 50 μm. *P < 0.05 by Wilcoxon two‐sample test (n = 6 for each group).BWestern blot analysis of kidney tissues from non‐diabetic controls and diabetic nephropathy subjects. Expression levels of KDM6A, KLF10, nephrin, and WT‐1 in kidney tissues were determined by immunoblotting using the indicated antibodies. Relative protein levels in kidney tissues were normalized to actin. *P < 0.05 by Wilcoxon two‐sample test (n = 6 for each group).CLevels of KDM6A and KLF10, nephrin mRNAs in urine exosomes of diabetic nephropathy patients and non‐diabetic controls. Relative mRNA levels in human urinary exosomes were normalized to 18S rRNA. Horizontal lines are medians. *P < 0.05, **P < 0.01, and ***P < 0.001 by Wilcoxon two‐sample test (n = 12 for each group).Data information: Data are expressed as mean ± SEM (A and B). See the exact P‐values for comparison tests in Appendix Table S7. Image collected and cropped by CiteAb from the following publication (https://pubmed.ncbi.nlm.nih.gov/30948420), licensed under a CC-BY license. Not internally tested by R&D Systems.
Detection of Mouse Nephrin by Immunocytochemistry/Immunofluorescence
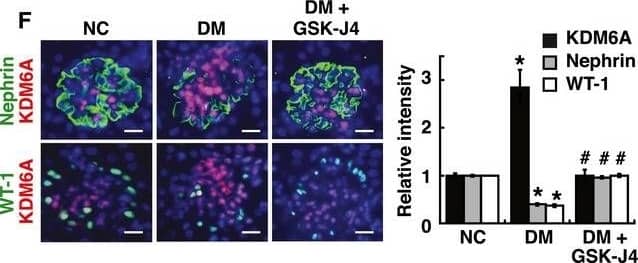
KDM6A promotes podocyte and kidney dysfunction in diabetic miceARelative mRNA levels of KDM6A, nephrin and WT‐1, normalized to beta‐actin, expressed in kidney glomeruli of normal and diabetic mice at 4, 8, and 12 weeks after diabetic induction. *Significant differences (P < 0.05) compared with normal controls (Wilcoxon two‐sample test; n = 8 each).BWestern blot analysis of nephrin, KDM6A, and H3K27me3 in kidney glomeruli of normal and diabetic mice at different time points. *P < 0.05 versus normal controls for the indicated time points (Wilcoxon two‐sample test; n = 3).CChanges in body weights and levels of blood glucose in normal, diabetic, and GSK‐J4‐treated diabetic mice. As noted, GSK‐J4 treatment did not significantly affect body weights or blood glucose levels in diabetic mice during the experimental period of 12 weeks (Wilcoxon two‐sample test; n = 8).DLevels of urinary protein excretion, weights of kidney, and levels of HbA1c in normal, diabetic, and GSK‐J4‐treated diabetic mice. Urinary total protein excretion, kidney weight, and levels of HbA1c were measured at 12 weeks after diabetic induction. The mean relative kidney weight (%) shown in the study is determined as the percent of kidneys out of total body weight, and the HbA1c level is defined as the ratio of HbA1c to the total hemoglobin (% HbA1c; DCCT unit). *P < 0.05 versus normal controls, #P < 0.05 versus untreated diabetic mice (parametric ANOVA and a Bonferroni post hoc test; n = 8).EWestern blot analysis of KDM6A, nephrin, WT‐1, and H3K27me3 expressed in kidney glomeruli of normal, diabetic, and GSK‐J4‐treated diabetic mice at 12 weeks after diabetic induction. *P < 0.05 versus normal controls, #P < 0.05 versus untreated diabetic mice (parametric ANOVA and a Bonferroni post hoc test; n = 3).FImmunofluorescence analysis of KDM6A, nephrin, and WT‐1 in kidney sections from normal, diabetic, and GSK‐J4‐treated diabetic mice. Green: nephrin or WT‐1; red: KDM6A; blue: DAPI. Scale bars, 20 μm. *P < 0.05 versus normal controls, #P < 0.05 versus untreated diabetic mice (parametric ANOVA and a Bonferroni post hoc test; n = 3).GImmunofluorescence staining of F‐actin and KDM6A in primary podocytes isolated from normal, diabetic, and GST‐J4‐treated diabetic mice. Green: F‐actin; red: KDM6A; blue: DAPI. Scale bars, 20 μm. Presented experiments were performed at least three times independently.Data information: Data are expressed as mean ± SEM. See the exact P‐values for comparison tests in Appendix Table S3. Image collected and cropped by CiteAb from the following publication (https://pubmed.ncbi.nlm.nih.gov/30948420), licensed under a CC-BY license. Not internally tested by R&D Systems.

