Detection of Porcine IL-1 beta/IL-1F2 by Immunocytochemistry/ Immunofluorescence
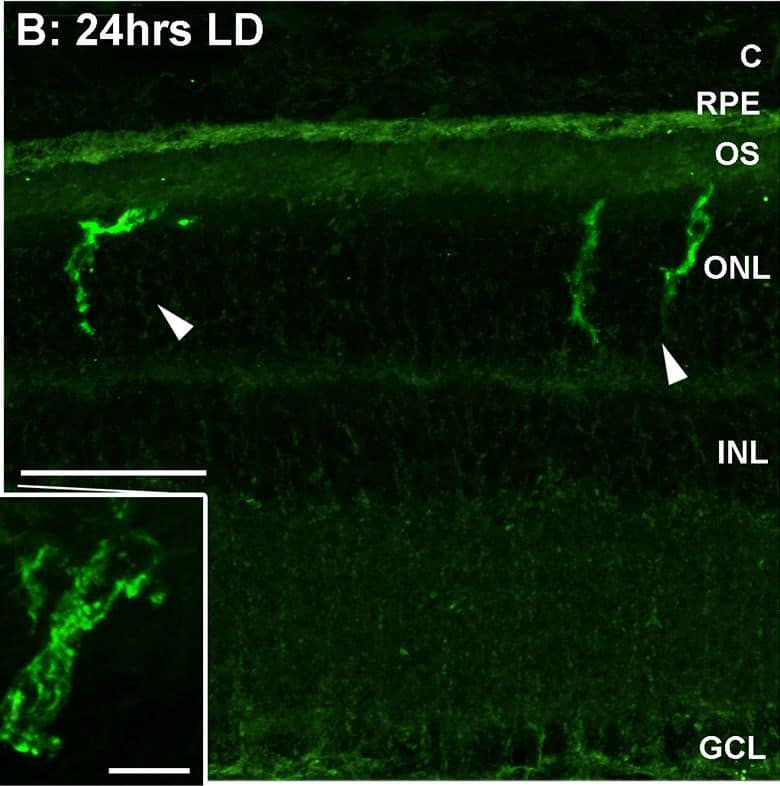
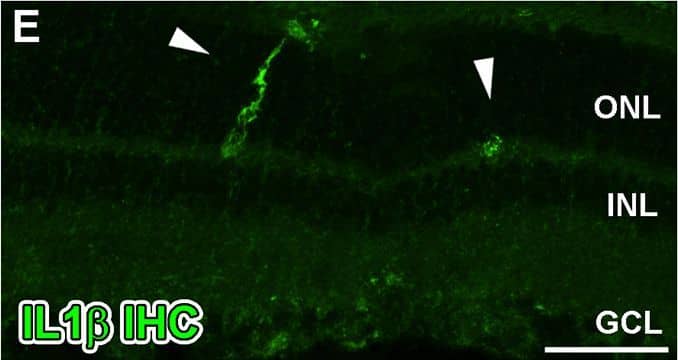
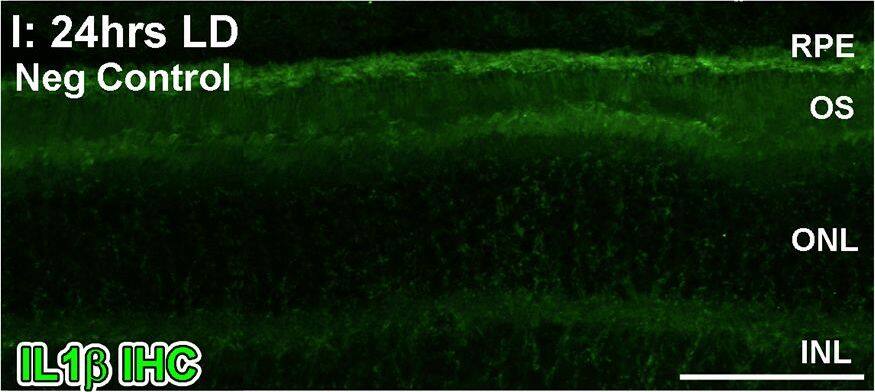
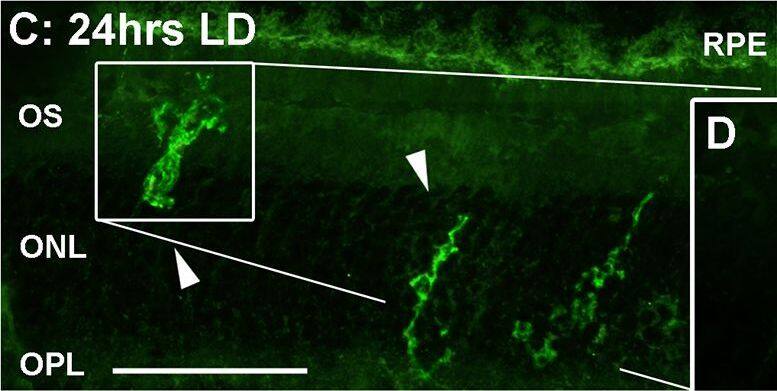
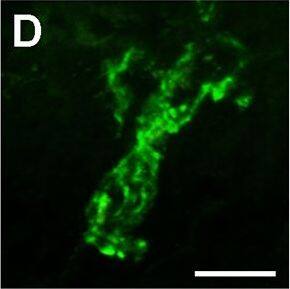
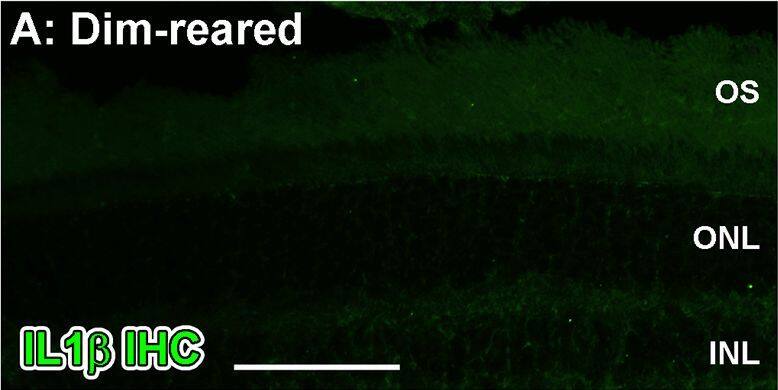
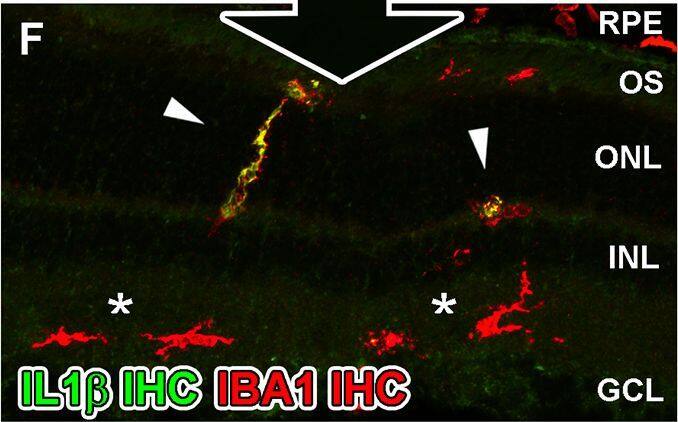
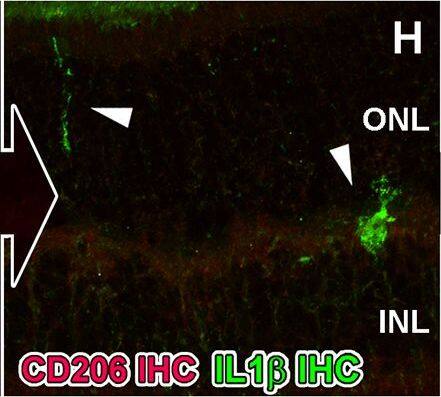
Spatiotemporal analysis of retinal Il-1 beta protein levels following LD.A-G: Immunohistochemical assessment of Il-1 beta expression (green) in retinal cryosections over the course of LD. A: Immunoreactivity (IR) for Il-1 beta protein was not observed in dim-reared animals. B-D: Il-1 beta-IR was present among ramified nuclei situated within the ONL and OS (arrowheads) immediately following exposure to 24hrs LD. E-F: Il-1 beta-IR co-localised with IBA1+ cells (red) situated in the ONL/OS, though was not apparent in IBA1+ cells outside the vicinity of the ONL (asterisks). G-H: Il-1 beta-expressing cells (H, arrowheads) did not show any discernible IR for the M2 marker CD206 (red). I: Negative control sections, in which the primary antibody was omitted, did not show any resemblance to the IR for Il-1 beta evidenced in C-D at 24hrs LD. J: ELISA for Il-1 beta protein indicated an increased abundance of the protein immediately after 24hrs LD (P<0.05), and which was virtually undetectable at all other time points. C, choroid; GCL, ganglion cell layer; INL, inner nuclear layer; IHC, immunohistochemistry; ONL, outer nuclear layer; OS, outer segments; RPE, retinal pigment epithelium. The trend in ELISA protein levels was significant by ANOVA (P < 0.05); N = 3 for each timepoint. Image collected and cropped by CiteAb from the following open publication (https://pubmed.ncbi.nlm.nih.gov/26630454), licensed under a CC-BY license. Not internally tested by R&D Systems.
Detection of Porcine IL-1 beta/IL-1F2 by Immunocytochemistry/ Immunofluorescence
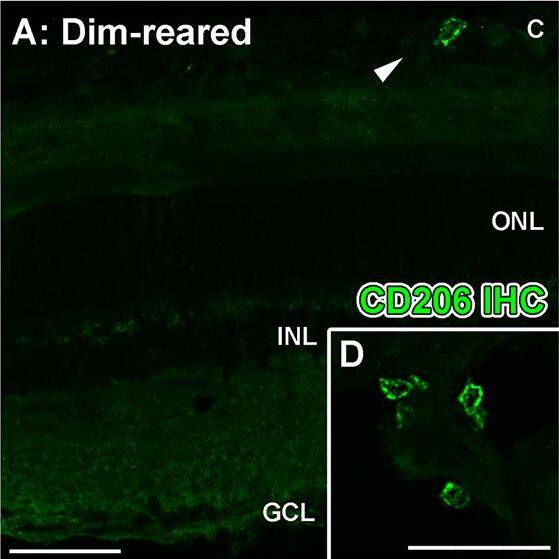
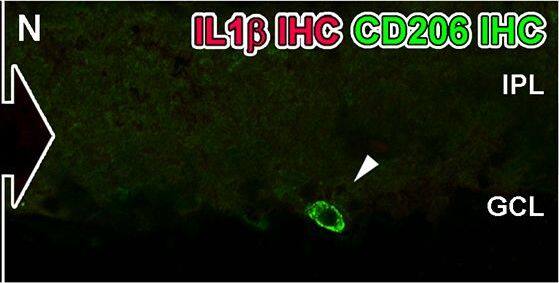
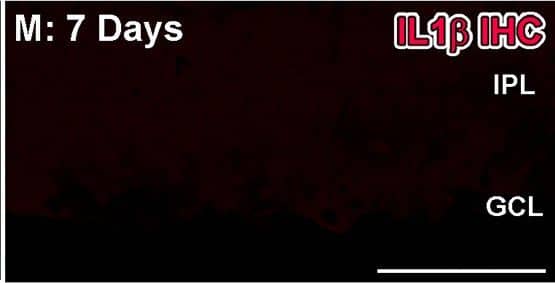
Spatiotemporal analysis of retinal CD206 protein levels following LD.A-L: investigation of CD206 immunoreactivity (IR, green) in retinal cryosections over the course of LD. A-B: In dim-reared animals, immunoreactivity (IR) for Il-1 beta protein was occasionally observed within nuclei (arrowheads) amongst the choroid (A) and ciliary body (B). C-E: Following 24hrs LD, CD206+ nuclei appeared from the ciliary body (C-D, arrowheads) and among the superficial retinal vasculature (E, arrowhead) F: At 24hrs LD, CD206+ cells were also more abundant within the ciliary body (arrowheads). G-I: There was increased abundance of CD206+ nuclei among optic nerve head (G-H) and superficial retinal vasculature (I) after 3 days post-exposure (arrowheads), compared to 24hrs LD. J: CD206+ cells were occasionally found accumulating within the choroid at 7 days post-exposure (arrowheads). K-L: All IR for CD206 was found to correlate with circular IBA1+ cells (red). M-N: CD206-expressing cells (N, arrowhead) did not show any detectable IR for the M1 marker Il-1 beta (red). O: Quantification of CD206 protein levels in retinas via ELISA. At 3 and 7 days post-exposure, the levels of CD206 protein were significantly higher compared to dim-reared controls (P<0.05). Progressive increases were observed during the post-exposure period, though this was not significant between 3 and 7 days (P>0.05). C, choroid; GCL, ganglion cell layer; INL, inner nuclear layer; IPL, inner plexiform layer; IHC, immunohistochemistry; ONL, outer nuclear layer; OS, outer segments; RPE, retinal pigment epithelium. The trend in ELISA protein levels was significant by ANOVA (P < 0.05); N = 3 for each timepoint. Image collected and cropped by CiteAb from the following open publication (https://pubmed.ncbi.nlm.nih.gov/26630454), licensed under a CC-BY license. Not internally tested by R&D Systems.
Detection of Porcine IL-1 beta/IL-1F2 by Flow Cytometry
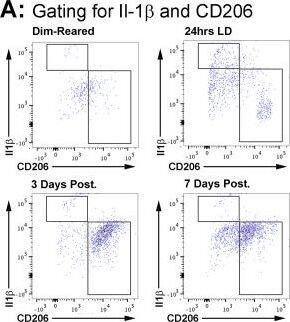
Correlation of CD206 and Il-1 beta immunolabelling within the CD11b+ macrophage population following LD.A: Representative flow cytometry plots examine CD206+ and Il1b+ cell counts within the CD11b population following light damage. For the most part, Il-1 beta and CD206 cells occupied mutually distinct subsets within the population CD11b cells. B: Quantification of Il-1 beta+/CD206- and CD206+/Il-1 beta- cells as percentage of the CD11b+ population following LD. There was a sharp increase in the proportion of Il-1 beta+/CD206- cells immediately following 24hrs LD (P<0.05), though this then decreased dramatically afterward and was similar to control samples by 7 days (P>0.05). For CD206+/Il-1 beta- cells, there was no change in their proportion at 24hrs LD (P>0.05). At 3 days post-exposure however the proportion of CD206+/Il-1 beta- cells had tripled (P<0.05), though this was then reduced to near control proportions by 7 days post-exposure (P<0.05). The trend of both Il-1 beta+/CD206- and CD206+/Il-1 beta- cells across the time course were significant by ANOVA (P < 0.05); N = 5 for each timepoint. Image collected and cropped by CiteAb from the following open publication (https://pubmed.ncbi.nlm.nih.gov/26630454), licensed under a CC-BY license. Not internally tested by R&D Systems.
Detection of Porcine IL-1 beta/IL-1F2 by Immunocytochemistry/ Immunofluorescence
Spatiotemporal analysis of retinal Il-1 beta protein levels following LD.A-G: Immunohistochemical assessment of Il-1 beta expression (green) in retinal cryosections over the course of LD. A: Immunoreactivity (IR) for Il-1 beta protein was not observed in dim-reared animals. B-D: Il-1 beta-IR was present among ramified nuclei situated within the ONL and OS (arrowheads) immediately following exposure to 24hrs LD. E-F: Il-1 beta-IR co-localised with IBA1+ cells (red) situated in the ONL/OS, though was not apparent in IBA1+ cells outside the vicinity of the ONL (asterisks). G-H: Il-1 beta-expressing cells (H, arrowheads) did not show any discernible IR for the M2 marker CD206 (red). I: Negative control sections, in which the primary antibody was omitted, did not show any resemblance to the IR for Il-1 beta evidenced in C-D at 24hrs LD. J: ELISA for Il-1 beta protein indicated an increased abundance of the protein immediately after 24hrs LD (P<0.05), and which was virtually undetectable at all other time points. C, choroid; GCL, ganglion cell layer; INL, inner nuclear layer; IHC, immunohistochemistry; ONL, outer nuclear layer; OS, outer segments; RPE, retinal pigment epithelium. The trend in ELISA protein levels was significant by ANOVA (P < 0.05); N = 3 for each timepoint. Image collected and cropped by CiteAb from the following open publication (https://pubmed.ncbi.nlm.nih.gov/26630454), licensed under a CC-BY license. Not internally tested by R&D Systems.
Detection of Porcine IL-1 beta/IL-1F2 by Immunocytochemistry/ Immunofluorescence
Spatiotemporal analysis of retinal CD206 protein levels following LD.A-L: investigation of CD206 immunoreactivity (IR, green) in retinal cryosections over the course of LD. A-B: In dim-reared animals, immunoreactivity (IR) for Il-1 beta protein was occasionally observed within nuclei (arrowheads) amongst the choroid (A) and ciliary body (B). C-E: Following 24hrs LD, CD206+ nuclei appeared from the ciliary body (C-D, arrowheads) and among the superficial retinal vasculature (E, arrowhead) F: At 24hrs LD, CD206+ cells were also more abundant within the ciliary body (arrowheads). G-I: There was increased abundance of CD206+ nuclei among optic nerve head (G-H) and superficial retinal vasculature (I) after 3 days post-exposure (arrowheads), compared to 24hrs LD. J: CD206+ cells were occasionally found accumulating within the choroid at 7 days post-exposure (arrowheads). K-L: All IR for CD206 was found to correlate with circular IBA1+ cells (red). M-N: CD206-expressing cells (N, arrowhead) did not show any detectable IR for the M1 marker Il-1 beta (red). O: Quantification of CD206 protein levels in retinas via ELISA. At 3 and 7 days post-exposure, the levels of CD206 protein were significantly higher compared to dim-reared controls (P<0.05). Progressive increases were observed during the post-exposure period, though this was not significant between 3 and 7 days (P>0.05). C, choroid; GCL, ganglion cell layer; INL, inner nuclear layer; IPL, inner plexiform layer; IHC, immunohistochemistry; ONL, outer nuclear layer; OS, outer segments; RPE, retinal pigment epithelium. The trend in ELISA protein levels was significant by ANOVA (P < 0.05); N = 3 for each timepoint. Image collected and cropped by CiteAb from the following open publication (https://pubmed.ncbi.nlm.nih.gov/26630454), licensed under a CC-BY license. Not internally tested by R&D Systems.
Detection of Porcine IL-1 beta/IL-1F2 by Immunocytochemistry/ Immunofluorescence
Spatiotemporal analysis of retinal Il-1 beta protein levels following LD.A-G: Immunohistochemical assessment of Il-1 beta expression (green) in retinal cryosections over the course of LD. A: Immunoreactivity (IR) for Il-1 beta protein was not observed in dim-reared animals. B-D: Il-1 beta-IR was present among ramified nuclei situated within the ONL and OS (arrowheads) immediately following exposure to 24hrs LD. E-F: Il-1 beta-IR co-localised with IBA1+ cells (red) situated in the ONL/OS, though was not apparent in IBA1+ cells outside the vicinity of the ONL (asterisks). G-H: Il-1 beta-expressing cells (H, arrowheads) did not show any discernible IR for the M2 marker CD206 (red). I: Negative control sections, in which the primary antibody was omitted, did not show any resemblance to the IR for Il-1 beta evidenced in C-D at 24hrs LD. J: ELISA for Il-1 beta protein indicated an increased abundance of the protein immediately after 24hrs LD (P<0.05), and which was virtually undetectable at all other time points. C, choroid; GCL, ganglion cell layer; INL, inner nuclear layer; IHC, immunohistochemistry; ONL, outer nuclear layer; OS, outer segments; RPE, retinal pigment epithelium. The trend in ELISA protein levels was significant by ANOVA (P < 0.05); N = 3 for each timepoint. Image collected and cropped by CiteAb from the following open publication (https://pubmed.ncbi.nlm.nih.gov/26630454), licensed under a CC-BY license. Not internally tested by R&D Systems.
Detection of Porcine IL-1 beta/IL-1F2 by Immunocytochemistry/ Immunofluorescence
Spatiotemporal analysis of retinal Il-1 beta protein levels following LD.A-G: Immunohistochemical assessment of Il-1 beta expression (green) in retinal cryosections over the course of LD. A: Immunoreactivity (IR) for Il-1 beta protein was not observed in dim-reared animals. B-D: Il-1 beta-IR was present among ramified nuclei situated within the ONL and OS (arrowheads) immediately following exposure to 24hrs LD. E-F: Il-1 beta-IR co-localised with IBA1+ cells (red) situated in the ONL/OS, though was not apparent in IBA1+ cells outside the vicinity of the ONL (asterisks). G-H: Il-1 beta-expressing cells (H, arrowheads) did not show any discernible IR for the M2 marker CD206 (red). I: Negative control sections, in which the primary antibody was omitted, did not show any resemblance to the IR for Il-1 beta evidenced in C-D at 24hrs LD. J: ELISA for Il-1 beta protein indicated an increased abundance of the protein immediately after 24hrs LD (P<0.05), and which was virtually undetectable at all other time points. C, choroid; GCL, ganglion cell layer; INL, inner nuclear layer; IHC, immunohistochemistry; ONL, outer nuclear layer; OS, outer segments; RPE, retinal pigment epithelium. The trend in ELISA protein levels was significant by ANOVA (P < 0.05); N = 3 for each timepoint. Image collected and cropped by CiteAb from the following open publication (https://pubmed.ncbi.nlm.nih.gov/26630454), licensed under a CC-BY license. Not internally tested by R&D Systems.
Detection of Porcine IL-1 beta/IL-1F2 by Western Blot
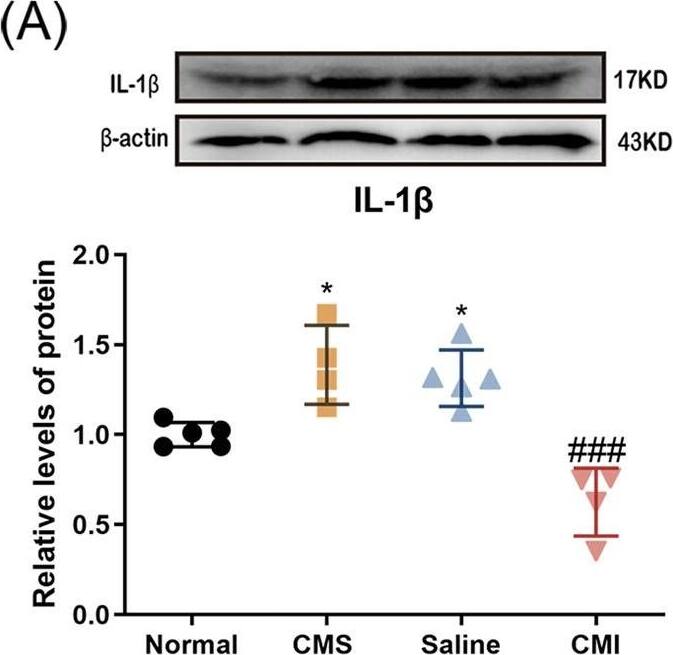
The effect of chronic clomipramine treatment on the hippocampal NLRP3 inflammasome level in the CMS-treated rats.The protein levels of A IL-1 beta, B cleaved caspase-1, C NLRP3, D ASC, and E pro-caspase-1 (n = 4/group) were analyzed by western blot. All data are expressed as the mean ± SD. ##p < 0.01, ###p < 0.001 compared to saline-treated rats. *p < 0.05, **p <0.01, ***p < 0.001 compared to non-stressed control rats. Image collected and cropped by CiteAb from the following open publication (https://pubmed.ncbi.nlm.nih.gov/35688836), licensed under a CC-BY license. Not internally tested by R&D Systems.
Detection of Porcine IL-1 beta/IL-1F2 by Immunocytochemistry/ Immunofluorescence
Spatiotemporal analysis of retinal Il-1 beta protein levels following LD.A-G: Immunohistochemical assessment of Il-1 beta expression (green) in retinal cryosections over the course of LD. A: Immunoreactivity (IR) for Il-1 beta protein was not observed in dim-reared animals. B-D: Il-1 beta-IR was present among ramified nuclei situated within the ONL and OS (arrowheads) immediately following exposure to 24hrs LD. E-F: Il-1 beta-IR co-localised with IBA1+ cells (red) situated in the ONL/OS, though was not apparent in IBA1+ cells outside the vicinity of the ONL (asterisks). G-H: Il-1 beta-expressing cells (H, arrowheads) did not show any discernible IR for the M2 marker CD206 (red). I: Negative control sections, in which the primary antibody was omitted, did not show any resemblance to the IR for Il-1 beta evidenced in C-D at 24hrs LD. J: ELISA for Il-1 beta protein indicated an increased abundance of the protein immediately after 24hrs LD (P<0.05), and which was virtually undetectable at all other time points. C, choroid; GCL, ganglion cell layer; INL, inner nuclear layer; IHC, immunohistochemistry; ONL, outer nuclear layer; OS, outer segments; RPE, retinal pigment epithelium. The trend in ELISA protein levels was significant by ANOVA (P < 0.05); N = 3 for each timepoint. Image collected and cropped by CiteAb from the following open publication (https://pubmed.ncbi.nlm.nih.gov/26630454), licensed under a CC-BY license. Not internally tested by R&D Systems.
Detection of Porcine IL-1 beta/IL-1F2 by Immunocytochemistry/ Immunofluorescence
Spatiotemporal analysis of retinal CD206 protein levels following LD.A-L: investigation of CD206 immunoreactivity (IR, green) in retinal cryosections over the course of LD. A-B: In dim-reared animals, immunoreactivity (IR) for Il-1 beta protein was occasionally observed within nuclei (arrowheads) amongst the choroid (A) and ciliary body (B). C-E: Following 24hrs LD, CD206+ nuclei appeared from the ciliary body (C-D, arrowheads) and among the superficial retinal vasculature (E, arrowhead) F: At 24hrs LD, CD206+ cells were also more abundant within the ciliary body (arrowheads). G-I: There was increased abundance of CD206+ nuclei among optic nerve head (G-H) and superficial retinal vasculature (I) after 3 days post-exposure (arrowheads), compared to 24hrs LD. J: CD206+ cells were occasionally found accumulating within the choroid at 7 days post-exposure (arrowheads). K-L: All IR for CD206 was found to correlate with circular IBA1+ cells (red). M-N: CD206-expressing cells (N, arrowhead) did not show any detectable IR for the M1 marker Il-1 beta (red). O: Quantification of CD206 protein levels in retinas via ELISA. At 3 and 7 days post-exposure, the levels of CD206 protein were significantly higher compared to dim-reared controls (P<0.05). Progressive increases were observed during the post-exposure period, though this was not significant between 3 and 7 days (P>0.05). C, choroid; GCL, ganglion cell layer; INL, inner nuclear layer; IPL, inner plexiform layer; IHC, immunohistochemistry; ONL, outer nuclear layer; OS, outer segments; RPE, retinal pigment epithelium. The trend in ELISA protein levels was significant by ANOVA (P < 0.05); N = 3 for each timepoint. Image collected and cropped by CiteAb from the following open publication (https://pubmed.ncbi.nlm.nih.gov/26630454), licensed under a CC-BY license. Not internally tested by R&D Systems.
Detection of Porcine IL-1 beta/IL-1F2 by Immunocytochemistry/ Immunofluorescence
Spatiotemporal analysis of retinal Il-1 beta protein levels following LD.A-G: Immunohistochemical assessment of Il-1 beta expression (green) in retinal cryosections over the course of LD. A: Immunoreactivity (IR) for Il-1 beta protein was not observed in dim-reared animals. B-D: Il-1 beta-IR was present among ramified nuclei situated within the ONL and OS (arrowheads) immediately following exposure to 24hrs LD. E-F: Il-1 beta-IR co-localised with IBA1+ cells (red) situated in the ONL/OS, though was not apparent in IBA1+ cells outside the vicinity of the ONL (asterisks). G-H: Il-1 beta-expressing cells (H, arrowheads) did not show any discernible IR for the M2 marker CD206 (red). I: Negative control sections, in which the primary antibody was omitted, did not show any resemblance to the IR for Il-1 beta evidenced in C-D at 24hrs LD. J: ELISA for Il-1 beta protein indicated an increased abundance of the protein immediately after 24hrs LD (P<0.05), and which was virtually undetectable at all other time points. C, choroid; GCL, ganglion cell layer; INL, inner nuclear layer; IHC, immunohistochemistry; ONL, outer nuclear layer; OS, outer segments; RPE, retinal pigment epithelium. The trend in ELISA protein levels was significant by ANOVA (P < 0.05); N = 3 for each timepoint. Image collected and cropped by CiteAb from the following open publication (https://pubmed.ncbi.nlm.nih.gov/26630454), licensed under a CC-BY license. Not internally tested by R&D Systems.
Detection of Porcine IL-1 beta/IL-1F2 by Immunocytochemistry/ Immunofluorescence
Spatiotemporal analysis of retinal Il-1 beta protein levels following LD.A-G: Immunohistochemical assessment of Il-1 beta expression (green) in retinal cryosections over the course of LD. A: Immunoreactivity (IR) for Il-1 beta protein was not observed in dim-reared animals. B-D: Il-1 beta-IR was present among ramified nuclei situated within the ONL and OS (arrowheads) immediately following exposure to 24hrs LD. E-F: Il-1 beta-IR co-localised with IBA1+ cells (red) situated in the ONL/OS, though was not apparent in IBA1+ cells outside the vicinity of the ONL (asterisks). G-H: Il-1 beta-expressing cells (H, arrowheads) did not show any discernible IR for the M2 marker CD206 (red). I: Negative control sections, in which the primary antibody was omitted, did not show any resemblance to the IR for Il-1 beta evidenced in C-D at 24hrs LD. J: ELISA for Il-1 beta protein indicated an increased abundance of the protein immediately after 24hrs LD (P<0.05), and which was virtually undetectable at all other time points. C, choroid; GCL, ganglion cell layer; INL, inner nuclear layer; IHC, immunohistochemistry; ONL, outer nuclear layer; OS, outer segments; RPE, retinal pigment epithelium. The trend in ELISA protein levels was significant by ANOVA (P < 0.05); N = 3 for each timepoint. Image collected and cropped by CiteAb from the following open publication (https://pubmed.ncbi.nlm.nih.gov/26630454), licensed under a CC-BY license. Not internally tested by R&D Systems.
Detection of Porcine IL-1 beta/IL-1F2 by Immunocytochemistry/ Immunofluorescence
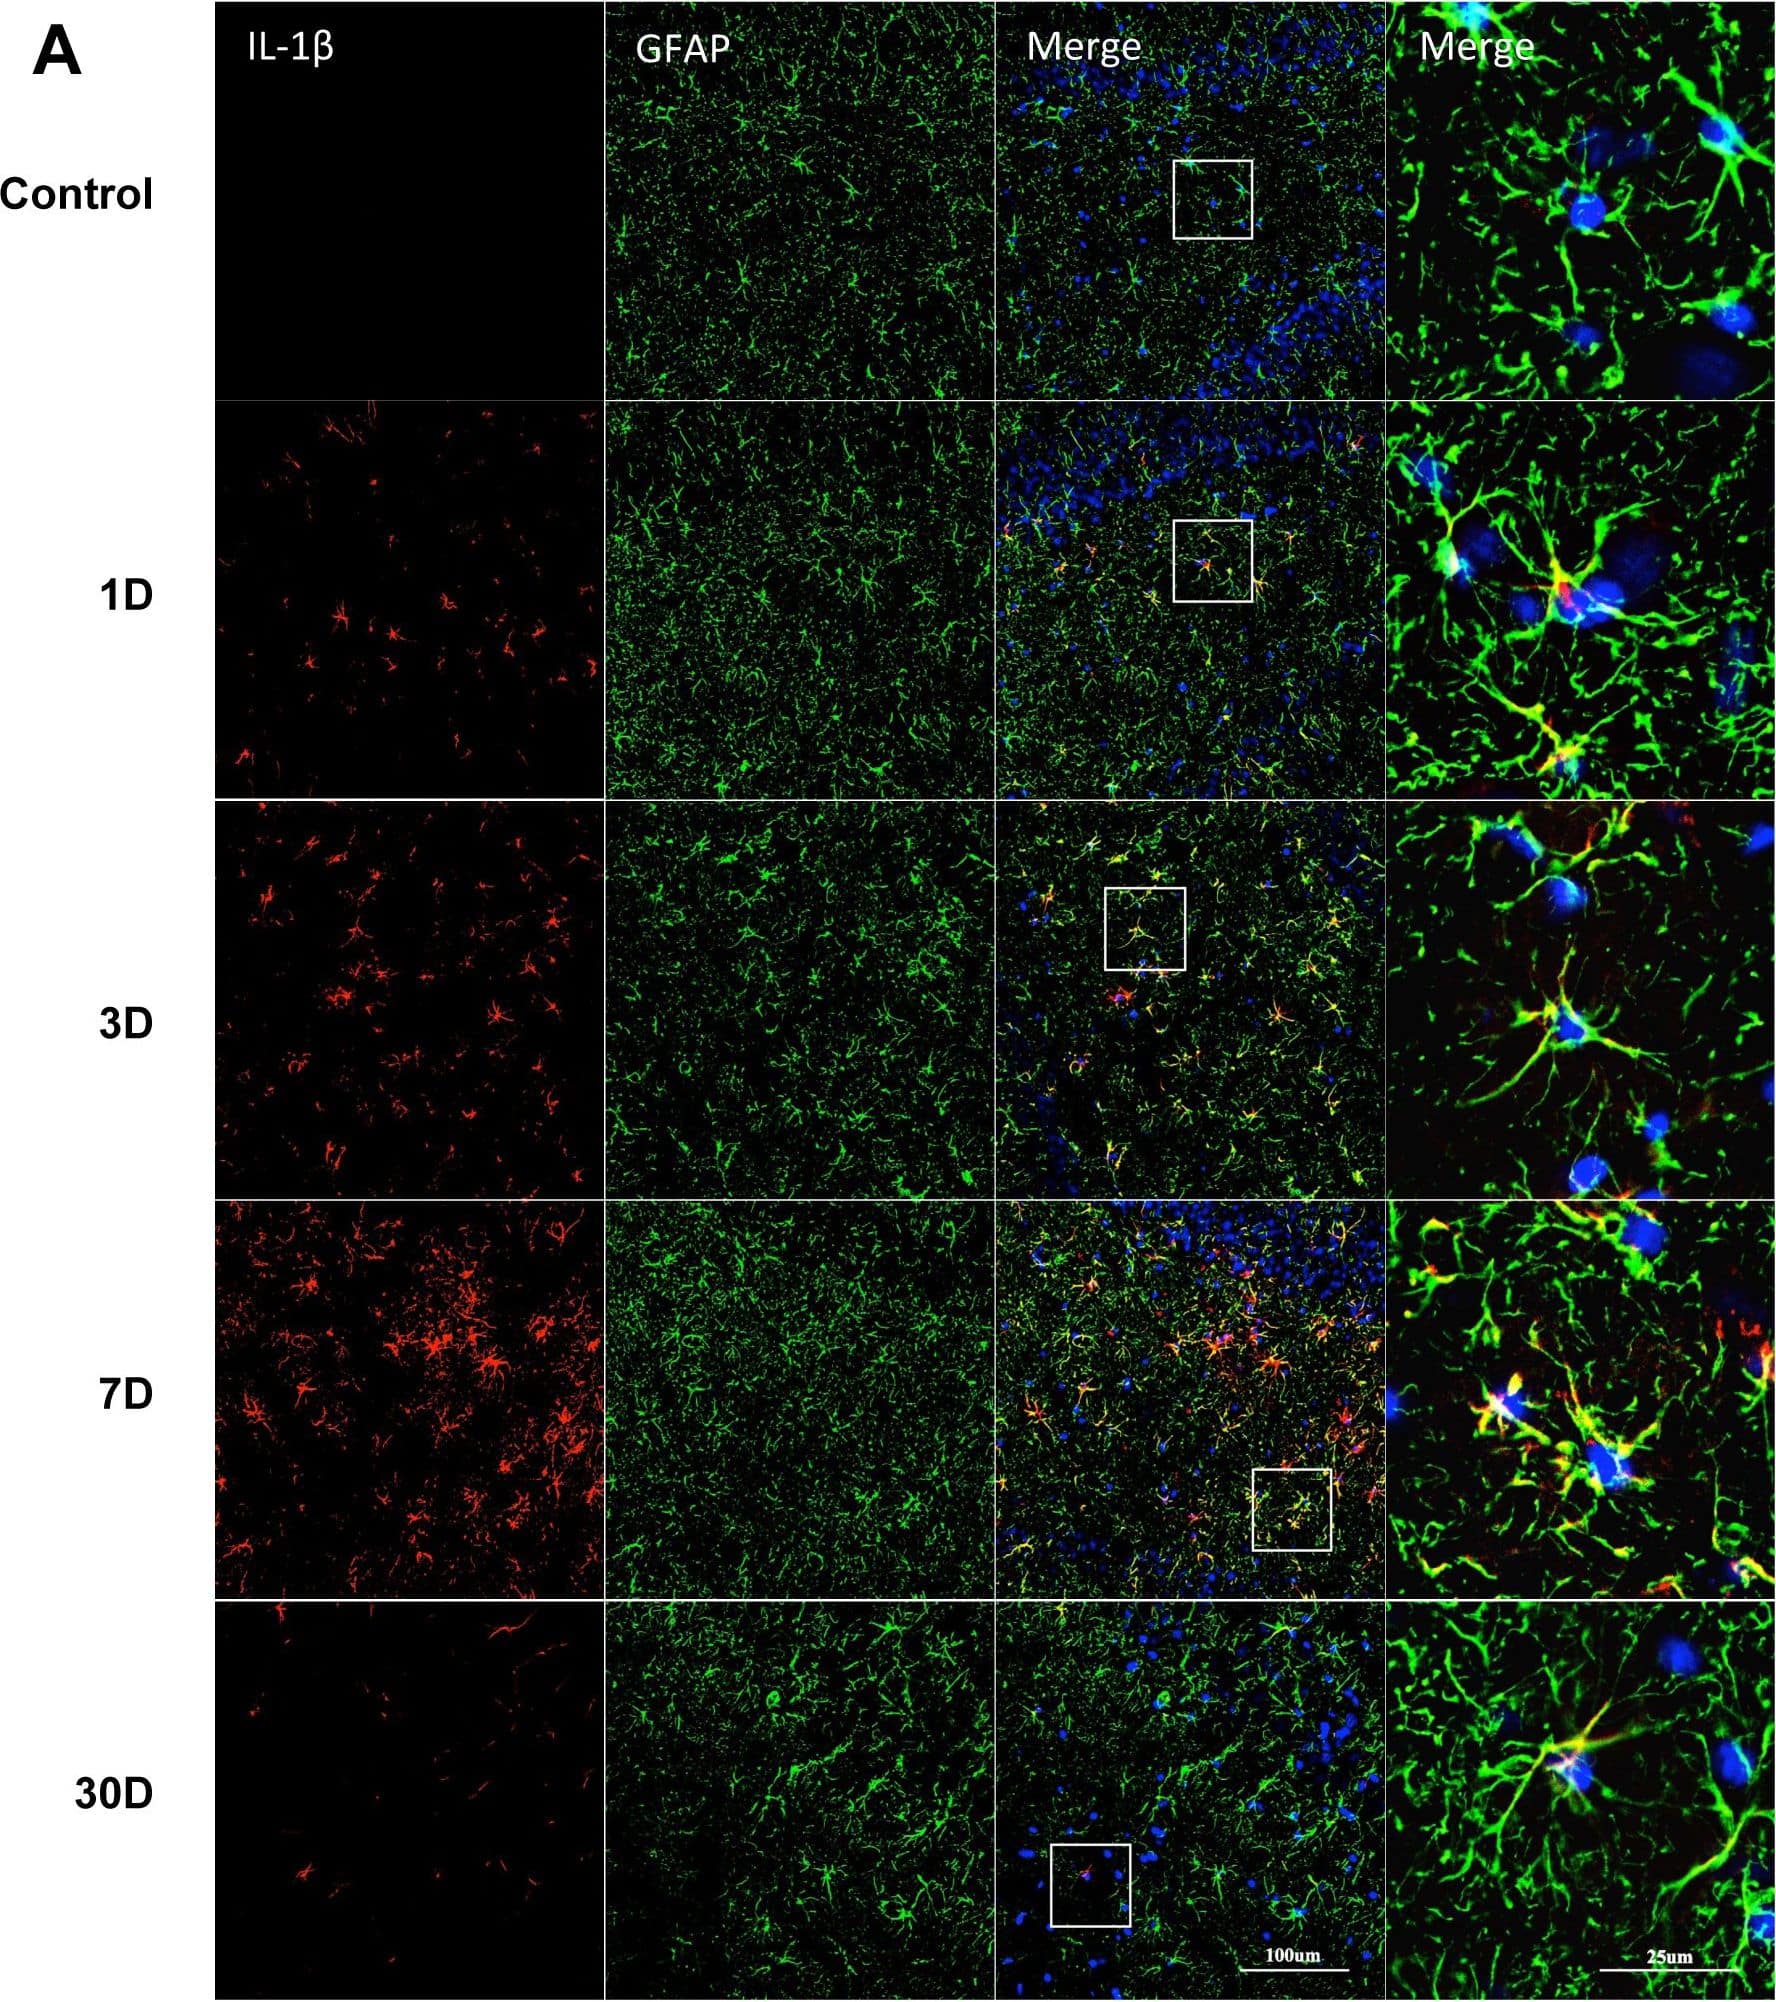
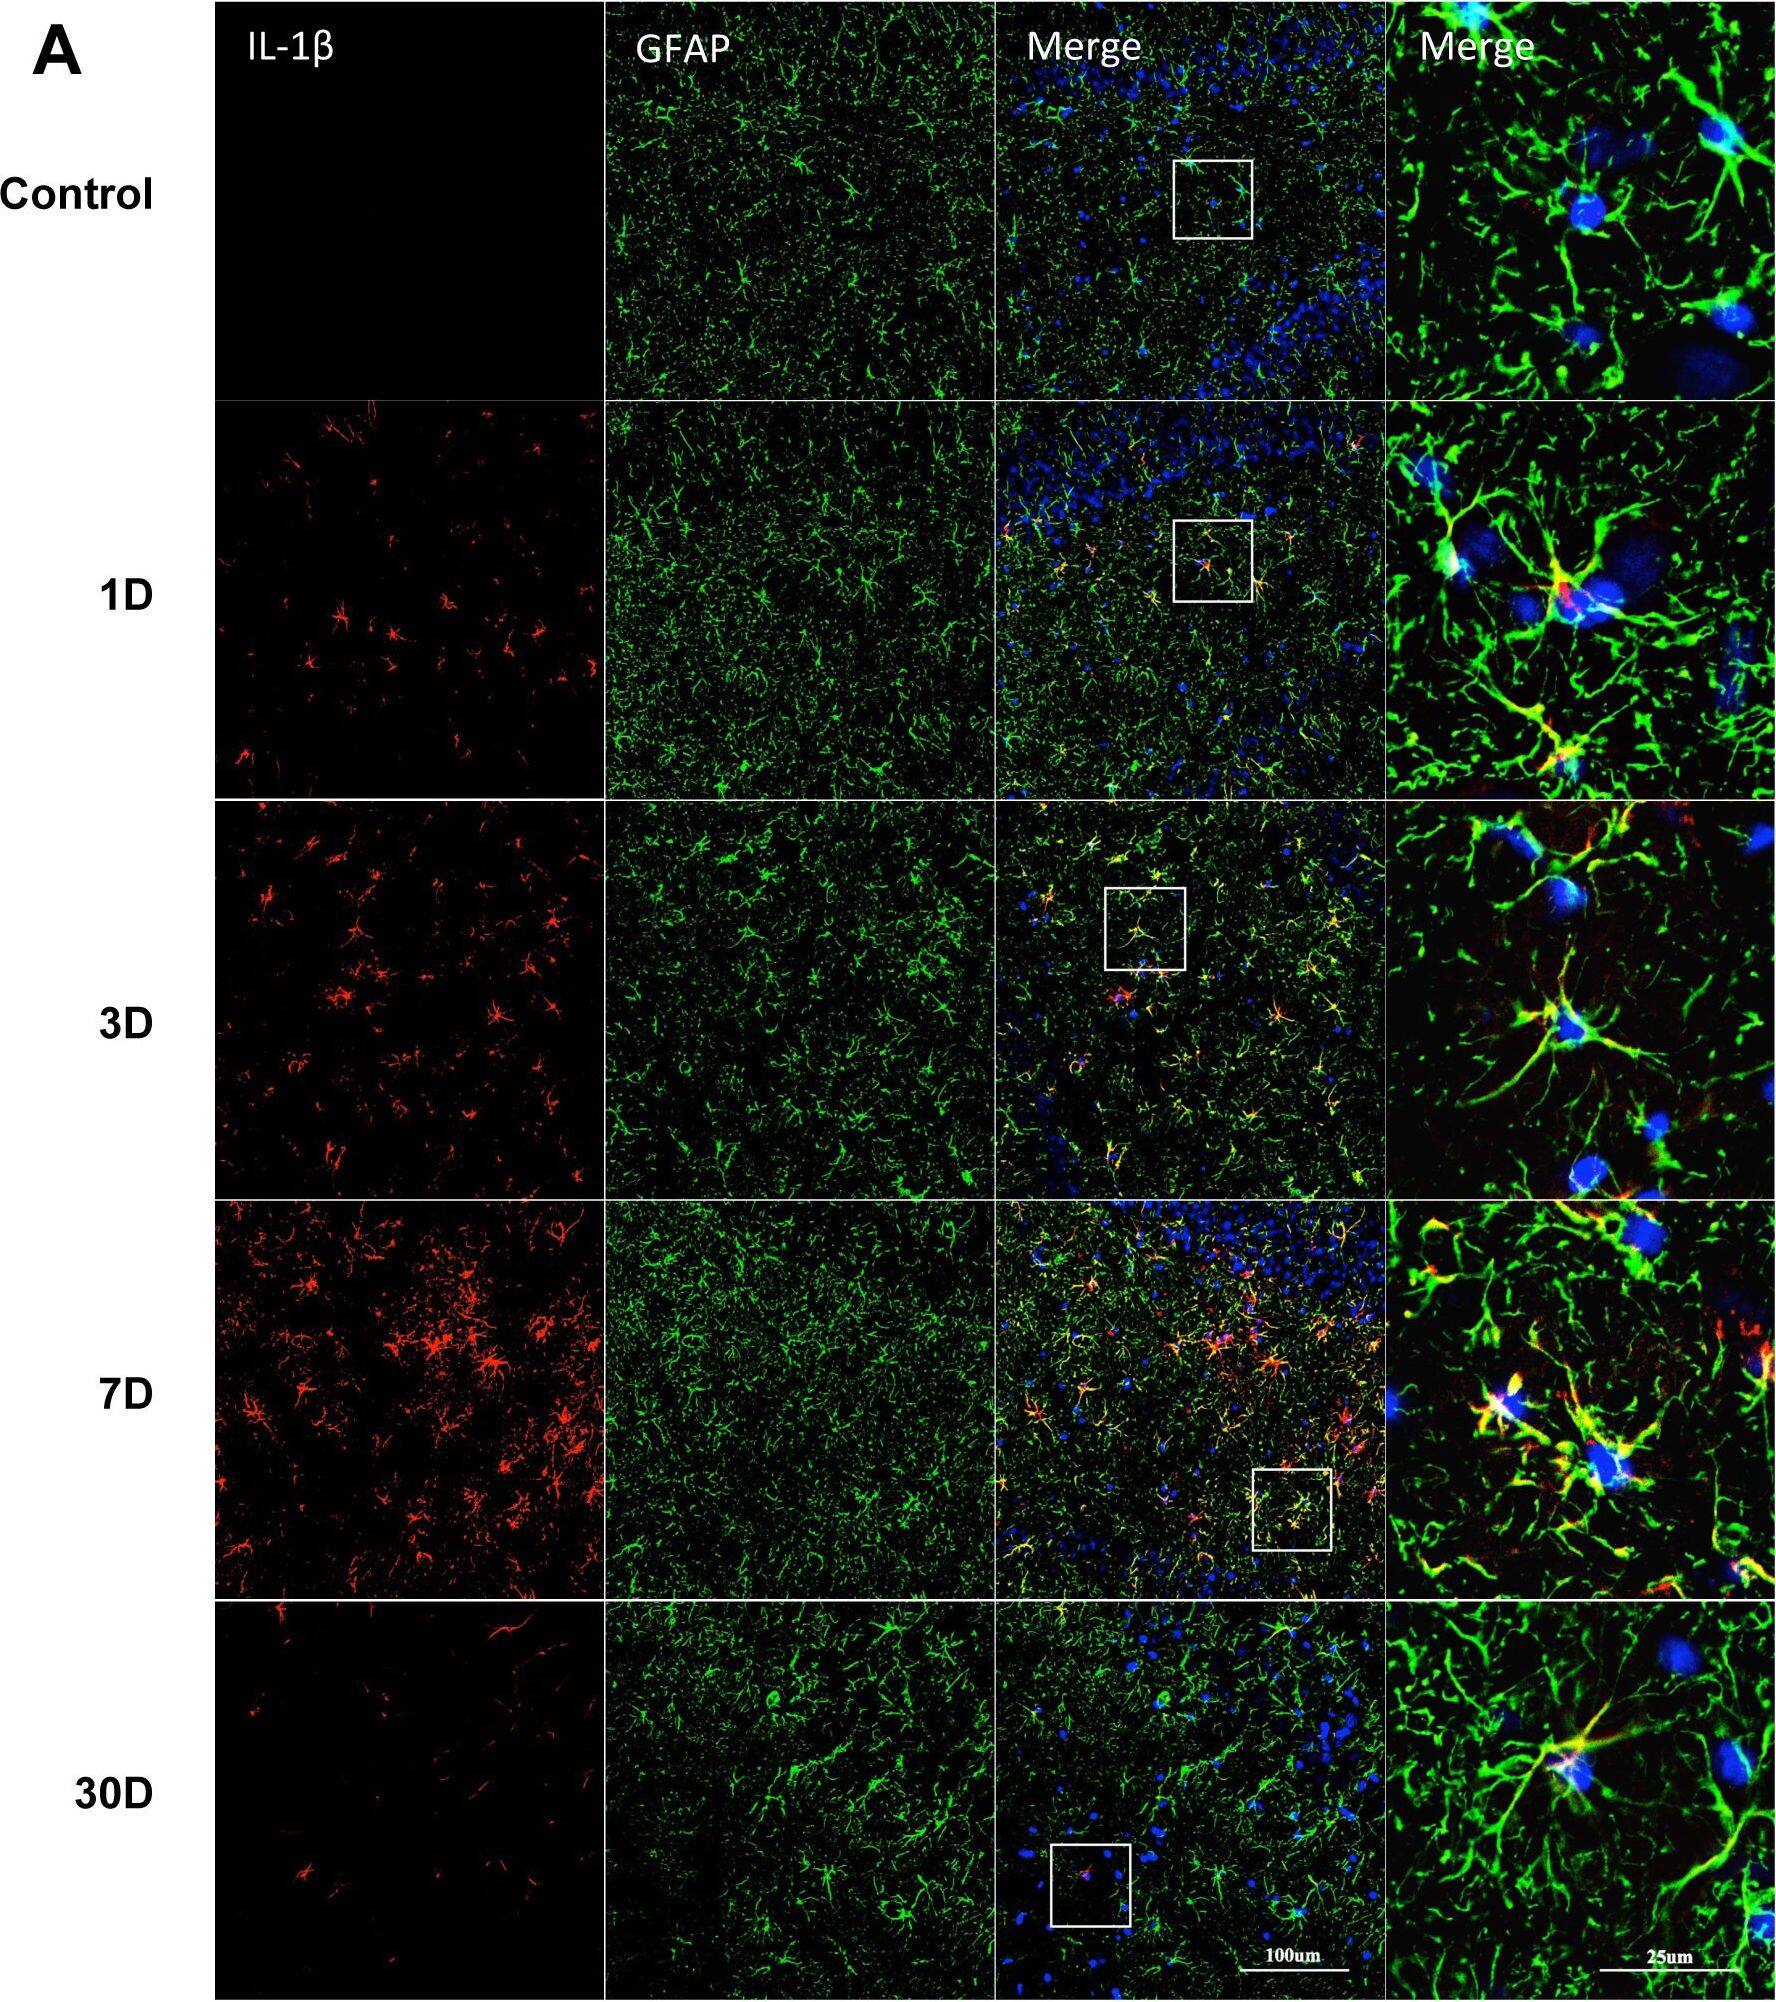
Sustained IL-1 beta up-regulation in hippocampal astrocytes.IL-1 beta immunoreactivity was measured in GFAP-positive cells after LPS exposure or saline. Levels of IL-1 beta were found up-regulated from day 1 up to day 30. Higher magnification insets highlight the co-localization of IL-1 beta with GFAP (A). The ratio of IL-1 beta positive astrocytes in total astrocytes (GFAP positive cells) was quantified (B). Pictures show DG area, data are expressed as mean ± standard error of the mean (n = 4) and compared by 1-way analysis of variance followed with Boferroni post hoc analysis, **p<0.01, ***p<0.001 vs Control. Image collected and cropped by CiteAb from the following open publication (https://dx.plos.org/10.1371/journal.pone.0106331), licensed under a CC-BY license. Not internally tested by R&D Systems.
Detection of Rat IL-1 beta/IL-1F2 by Immunocytochemistry/ Immunofluorescence
Sustained IL-1 beta up-regulation in hippocampal astrocytes.IL-1 beta immunoreactivity was measured in GFAP-positive cells after LPS exposure or saline. Levels of IL-1 beta were found up-regulated from day 1 up to day 30. Higher magnification insets highlight the co-localization of IL-1 beta with GFAP (A). The ratio of IL-1 beta positive astrocytes in total astrocytes (GFAP positive cells) was quantified (B). Pictures show DG area, data are expressed as mean ± standard error of the mean (n = 4) and compared by 1-way analysis of variance followed with Boferroni post hoc analysis, **p<0.01, ***p<0.001 vs Control. Image collected and cropped by CiteAb from the following open publication (https://dx.plos.org/10.1371/journal.pone.0106331), licensed under a CC-BY license. Not internally tested by R&D Systems.


