Mouse IL-1 beta/IL-1F2 ELISA Kit - Quantikine Best Seller
R&D Systems, part of Bio-Techne | Catalog # MLB00C

Key Product Details
Assay Length
Sample Type & Volume Required Per Well
Sensitivity
Assay Range
Product Summary for Mouse IL-1 beta/IL-1F2 Quantikine ELISA Kit
Product Specifications
Measurement
Detection Method
Conjugate
Reactivity
Specificity
Cross-reactivity
Interference
Sample Values
| Sample Type | Mean of Detectable (pg/mL) | % Detectable | Range (pg/mL) |
| Serum (n=20) | 27.6 | 10 | ND-37.9 |
| Sample Type | Day 3 (pg/mL) | Day 6 (pg/mL) |
| J774A.1 Unstimulated | ND | ND |
| J774A.1 Stimulated with LPS + GM-CSF | 587 | 938 |
| Tissue Lysate | (pg/mL) |
| Brain | 20.9 |
| Heart | 28.3 |
| Kidney | 111 |
| Liver | 347 |
| Lung | 115 |
| Spleen | 987 |
Precision
Intra-Assay Precision (Precision within an assay) Three samples of known concentration were tested on one plate to assess intra-assay precision.
Inter-Assay Precision (Precision between assays) Three samples of known concentration were tested in separate assays to assess inter-assay precision.
Cell Culture Supernates, EDTA Plasma, Heparin Plasma, Serum, Tissue Lysates
| Intra-Assay Precision | Inter-Assay Precision | |||||
|---|---|---|---|---|---|---|
| Sample | 1 | 2 | 3 | 1 | 2 | 3 |
| n | 20 | 20 | 20 | 20 | 20 | 20 |
| Mean (pg/mL) | 33.5 | 92.9 | 386 | 34.6 | 93.5 | 423 |
| Standard Deviation | 2.5 | 4.3 | 11.7 | 2.9 | 6.2 | 23.9 |
| CV% | 7.5 | 4.6 | 3.0 | 8.4 | 6.6 | 5.7 |
Recovery for Mouse IL-1 beta/IL-1F2 Quantikine ELISA Kit
The recovery of mouse IL-1 beta spiked to three levels throughout the range of the assay in various matrices was evaluated.
| Sample Type | Average % Recovery | Range % |
|---|---|---|
| Cell Culture Supernates (n=4) | 106 | 95-119 |
| EDTA Plasma (n=4) | 108 | 101-117 |
| Heparin Plasma (n=4) | 97 | 87-114 |
| Serum (n=4) | 105 | 98-113 |
| Tissue Lysates (n=4) | 115 | 110-120 |
Linearity
To assess the linearity of the assay, samples containing and/or spiked with high concentrations of mouse IL-1 beta were serially diluted with Calibrator Diluent to produce samples with values within the dynamic range of the assay.

Scientific Data Images for Mouse IL-1 beta/IL-1F2 Quantikine ELISA Kit
Mouse IL-1 beta/IL-1F2 ELISA Standard Curve
Human E‑Cadherin Antibody
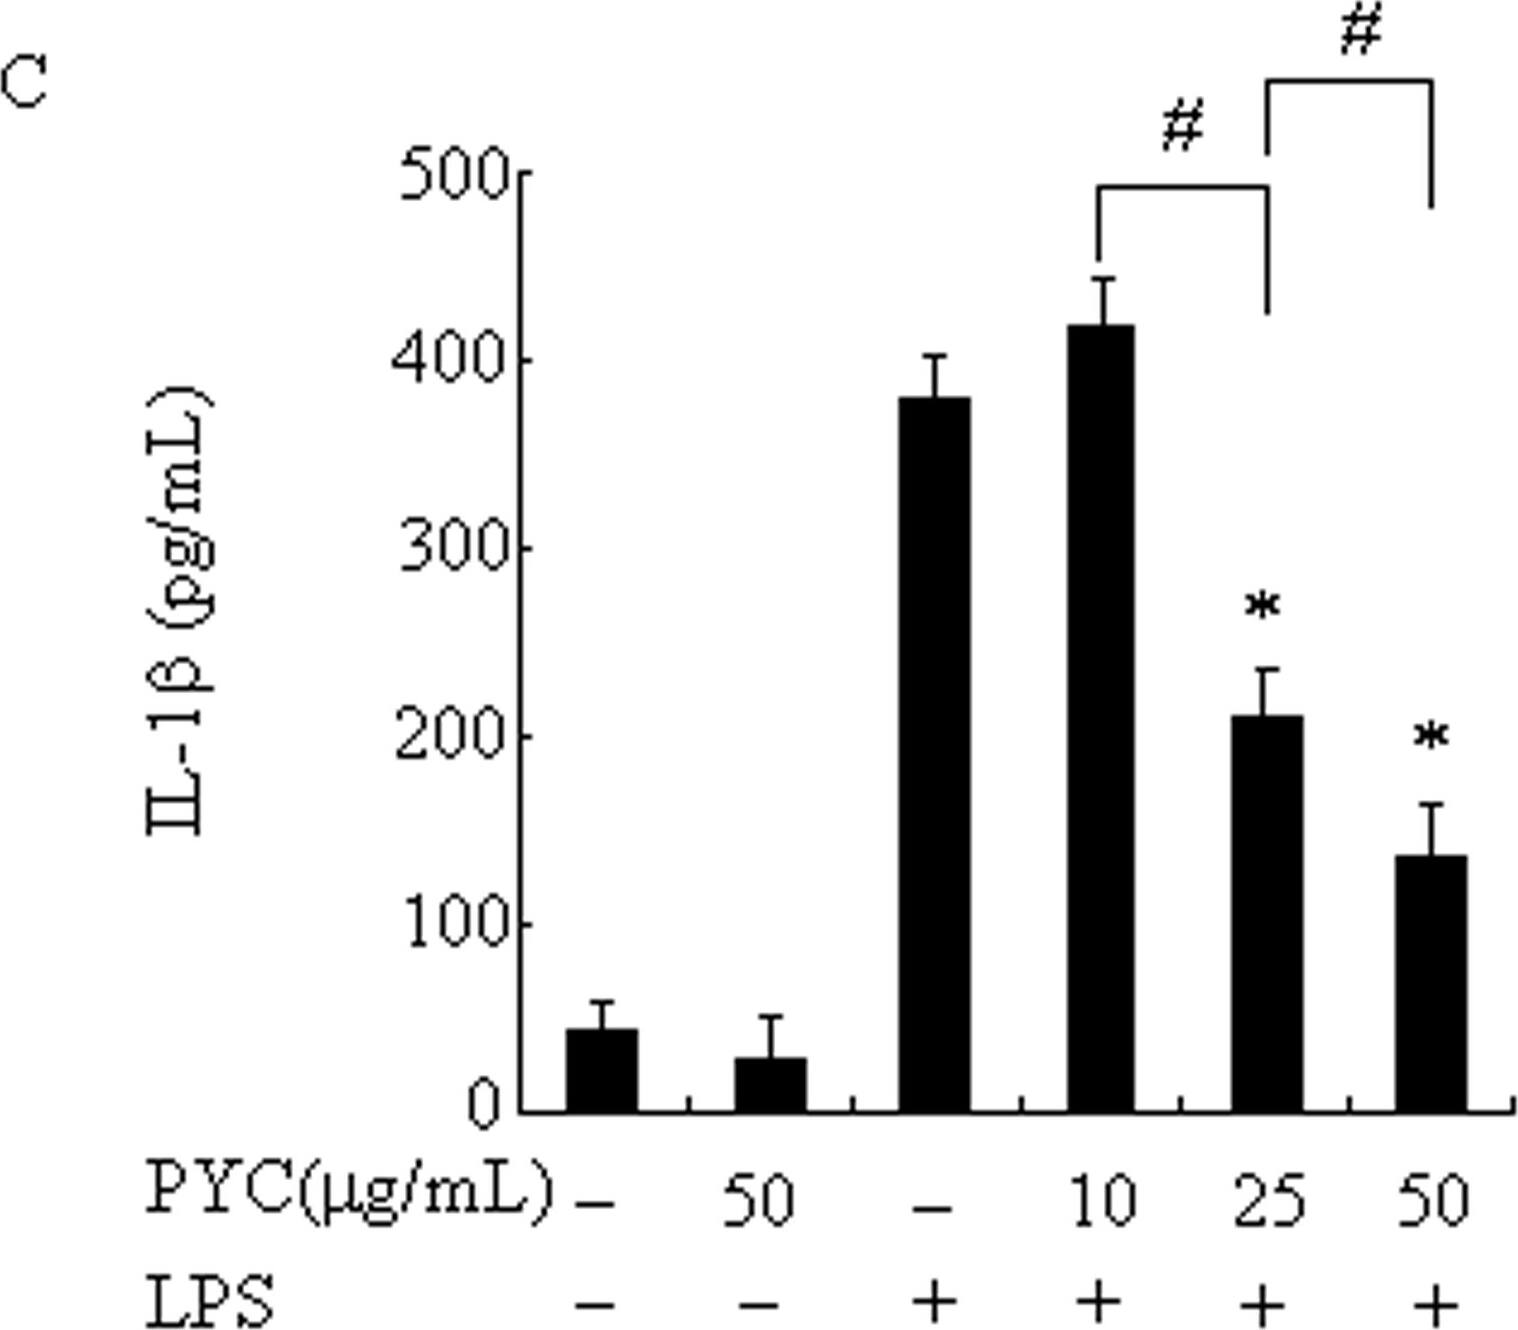
PYC suppressed LPS-induced proinflammatory cytokine production in BV2 microglia.Cells were incubated with the indicated concentrations of PYC or vehicle for 1h before LPS treatment (500ng/mL). After 24 h incubation, the culture supernatants were collected, and the amount of TNF-alpha, IL-6, IL-1 beta and IL-10 were measured by ELISA (A-D). Data are represented as mean ± SD from at least 3 independent experiments. *P< 0.05 compared with LPS alone. #P< 0.05. Image collected and cropped by CiteAb from the following open publication (https://dx.plos.org/10.1371/journal.pone.0137837), licensed under a CC-BY license. Not internally tested by R&D Systems.Preparation and Storage
Shipping
Stability & Storage
Background: IL-1 beta/IL-1F2
Long Name
Alternate Names
Entrez Gene IDs
Gene Symbol
Additional IL-1 beta/IL-1F2 Products
Product Documents for Mouse IL-1 beta/IL-1F2 Quantikine ELISA Kit
Product Specific Notices for Mouse IL-1 beta/IL-1F2 Quantikine ELISA Kit
For research use only
⚠ WARNING: This product can expose you to chemicals including N,N-Dimethylforamide, which is known to the State of California to cause cancer. For more information, go to www.P65Warnings.ca.gov.

