On This Page
1. Introduction to RNAscope™ ISH Technology in Any Species, Any Tissue
There is a great need for robust and straightforward assays to evaluate target gene expression in tissues, particularly for preclinical studies. Most in situ RNA detection techniques, however, lack the robustness and sensitivity to reliably detect expression of many target genes in various species and tissue types.
Although popular, immunohistochemistry (IHC) techniques rely on the availability of antibodies which can be expensive and time-consuming to develop. Furthermore, in some cases, it may not be possible to develop appropriate antibodies, particularly in species other than human, rat and mouse. While microarrays and PCR both provide useful molecular profiles of diseases, important clinically relevant cell and tissue context information is lost along with the spatial variation of gene expression patterns.
To solve these problems, Advanced Cell Diagnostics, a Bio-Techne Brand, (ACD) has developed the RNAscope technology — an advanced platform for in situ RNA detection. Probes can be developed for almost any target in any species in just two weeks — and come with a performance guarantee. Thanks to a proprietary double Z probe design, RNAscope ISH enables the detection of almost any RNA biomarker with single-molecule sensitivity and high specificity in tissues. It provides a universal solution to characterize tissue distribution of drug targets and biomarkers in a highly specific and sensitive manner, without the need for time-consuming antibody development and validation.
Addressing the requirements of investigators using a wide range of species and tissue types, section 2 presents data from a recent study of 24 tissue types from three commonly used preclinical animal models (rat, dog, and cynomolgus monkey) to provide a reference guide to optimizing the RNAscope assay.
The data details which pretreatment is best for different tissue types and provides recommendations on which control probes to be applied for sample qualification.
The data demonstrate that the fully automated RNAscope™ 2.5 LS Assay is capable of detecting a broad range of RNA targets in multiple tissue types and is ideal for the histopathological evaluation of drug targets and biomarkers in various animal models.
1.1 The RNAscope Workflow
RNAscope assays can be performed manually or on fully automated staining systems, including the Discovery Ultra and Discovery XT Automated IHC/ISH slide staining systems from Roche Tissue Diagnostics and Leica Biosystems’ BOND RX Research Advanced Staining System (see Table 1). The RNAscope procedure can be completed within a single day and consists of the steps outlined below.
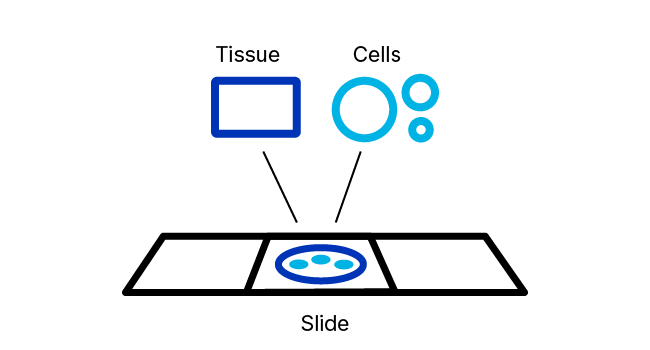
1. Permeabilize Cell or Tissue
1. Permeabilize Cell or Tissue
Fixed tissue sections or cells on slides are pretreated with a Pretreatment Kit to block endogenous peroxidase activity and optimally permeabilize samples to allow probe access to target RNA.
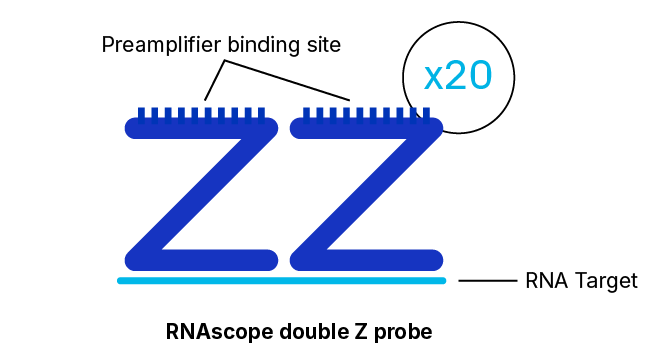
2. Hybridize to Target DNA
2. Hybridize to Target DNA
With ~20 specific double Z probe pairs per target probes hybridize to target RNA molecules.
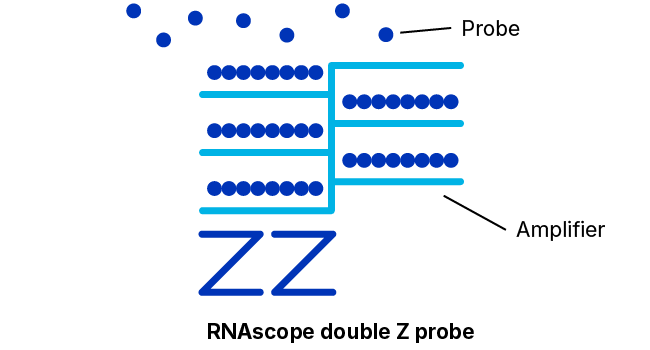
3. Amplify Signal
3. Amplify Signal
Detection Reagents amplify the hybridization signals via sequential hybridization of amplifiers and labeled probes.

4. Visualize with Morphology
4. Visualize with Morphology
Each punctate dot signal represents a single target RNA molecule and can be visualized with a microscope.

5. Quantify Single-Cell Expression
5. Quantify Single-Cell Expression
Single-molecules signals can be quantified on a cell-by-cell basis by manual counting or automated image analysis.
We also offer Professional Assay Services to make this technology available for customers preferring to outsource tissue-based projects. The assay provides visualization of each individual RNA molecule as a punctate dot under a standard bright-field microscope or fluorescent microscope. These dots can be quantified by counting the number of signal dots in individual cells, either manually or by using image analysis tools, such as HALO™ software (Indica Labs), and Aperio RNA ISH Algorithm (Leica Biosystems).
RNAscope Manual and Automated Chromogenic Assay Workflow
Table 1. Detailed RNAscope Assay Workflow
| Steps | Stage | Manual Assay | Leica Automated Staining Systems | Roche Automated Staining Systems |
|---|---|---|---|---|
| 1.Pretreatment | a. | Deparaffinization | Deparaffinization | Deparaffinization |
| b. | H2O2 block | Epitope retrieval | Epitope retrieval | |
| c. | Epitope retrieval | Protease | Protease | |
| d. | Protease | H2O2 block | H2O2 block | |
| 2. Hybridize | a. | Target probe hybridization | Target probe hybridization | Target probe hybridization |
| 3. Amplify | a. | AMP1 | AMP1 | AMP1 |
| b. | AMP2 | AMP2 | AMP2 | |
| c. | AMP3 | AMP3 | AMP3 | |
| d. | AMP4 | AMP4 | AMP4 | |
| e. | AMP5 | AMP5 | AMP5 | |
| f. | AMP6 | AMP6 | AMP6 | |
| g. | - | - | AMP7 | |
| 4. Stain and Detect | a. | DAB reaction | DAB reaction | DAB reaction |
| b. | Hematoxylin stain | Hematoxylin stain | Hematoxylin stain | |
| c. | Image detection under standard microscope/scanner | Image detection under standard microscope/scanner | Image detection under standard microscope/scanner |
1.2 The Importance of Controls
Success with any assay begins with good and consistent quality control practices. Two levels of quality control are recommended: a technical workflow check and a sample/RNA quality check.
Technical workflow quality control
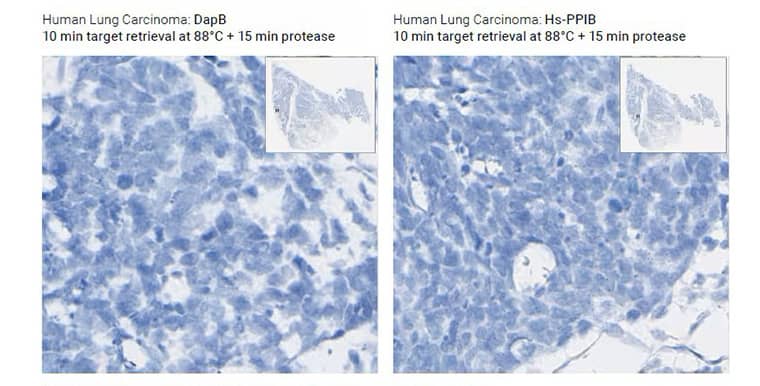
A technical quality control check ensures that the assay is working correctly. This is easily performed using a control sample tested on two separate slides – one slide with a housekeeping gene positive control probe and another slide with a nonspecific bacterial gene negative control probe (i.e., dapB). When the assay is run successfully, the positive control slide will display strong staining and the negative control slide will display no staining. Including technical quality controls with every assay is recommended.
Sample/RNA quality control
Although the RNAscope assay has universal conditions that work on most samples, tissue RNA quality and fixation conditions can vary. As a result, it is occasionally necessary to adjust the pretreatment conditions for optimal results. The Material and Methods section provides guidance on the optimization of pretreatment conditions, and section 2 details the optimal pretreatment conditions for 24 tissue types in rat, dog and cynomolgus monkey. However, checking tissue sample quality with positive and negative controls before running experiments is also recommended. This should result in a high positive control signal and no negative control background. If signal is low or background is detected, this is most often improved with adjustment to the pretreatment conditions (see Materials and Methods).
Choosing Appropriate Control Probes
Negative controls
Our universal negative control probe ensures that there is no background staining related to the assay and that the tissue specimen is appropriately prepared. The probe targets the dapB gene (GenBank accession #EF191515) from Bacillus subtilis strain SMY, a soil bacterium, and is suitable for all samples. Alternatively, probes from an unrelated species, for instance, a zebrafish probe on human tissue, can be used.
Positive controls
Positive control probes should be selected depending on the level of expression of the target gene.
1.3 Materials and methods
This section details the materials and methods used to obtain the data presented in section 2.
FFPE tissues
Multiple tissues from three commonly used animals for preclinical studies (rat, dog, and cynomolgus monkey) were harvested using a standard protocol at the drug safety research and development laboratory of Pfizer Global Research and Development (Groton, USA) (Table 2). Tissues were cut into 3 mm thickness, then fixed in 10% neutral-buffered formalin (NBF) for 24-48 hours. Fixed tissues were dehydrated in a graded series of ethanol and xylene, followed by infiltration of melted paraffin at 56°C in an automated processor. Tissue microarrays (TMAs) were constructed, sectioned at a thickness of 5 μm and mounted on the SuperFrost® Plus slides (Fisher brand Cat #12-550-15).
Table 2: Tissue types from three animal models used in this study
| Animal Models: Rat, Dog and Cynomologus Monkey | |
|---|---|
| Cardiovascular System | Heart |
| Endocrine glands/exocrine glands | Liver, Pancreas, Adrenal gland |
| GI tract | Esophagus, Stomach, Duodenum, Jejunum, Colon |
| Hematopoietic system | Thymus, Lymph node, Spleen, Tonsil |
| Nervous system | Spinal cord, Retina |
| Reproductive system | Epididymis, Prostate, Testis, Ovary |
| Respiratory system | Lung, Bronchus |
| Skin/soft tissues | Skin, Skeletal muscle |
| Urinary tract | Kidney, Urinary bladder |
Automated RNAscope™ 2.5 LS assay
Ready-to-use reagents from RNAscope™ 2.5 LS Reagent Kit-BROWN (Catalog # 322100) were loaded onto the Leica Biosystems’ BOND RX Research Advanced Staining System according to the user manual (Doc. No. 322100- USM). FFPE tissue sections were baked and deparaffinized on the instrument, followed by epitope retrieval (using Leica Epitope Retrieval Buffer 2 at 95°C or at 88°C for 15 min) and protease treatment (15 min at 40°C). Probe hybridization, signal amplification, colorimetric detection, and counterstaining were subsequently performed.
RNAscope probes
Control probes for low-, medium-, and high-expressing housekeeping genes (POLR2A, PPIB, and UBC, respectively) were tested for tissues from each species. Because the sequences of the human probes for housekeeping genes are over 95% homologous to the respective target mRNA sequences of cynomolgus monkey, human probes were used to test samples of cynomolgus monkey. The bacterial probe dapB was used as a negative control. Probes for the cell type biomarkers, proliferation markers, and apoptosis-related molecules used in this study were designed for each species. As summarized in Table 3, species-specific target probes were tested for all RNA targets except two genes, CD68 and KI67, for which human probes were used to detect cynomolgus monkey genes, due to 90-95% homology between the probe sequence and target mRNA sequence.
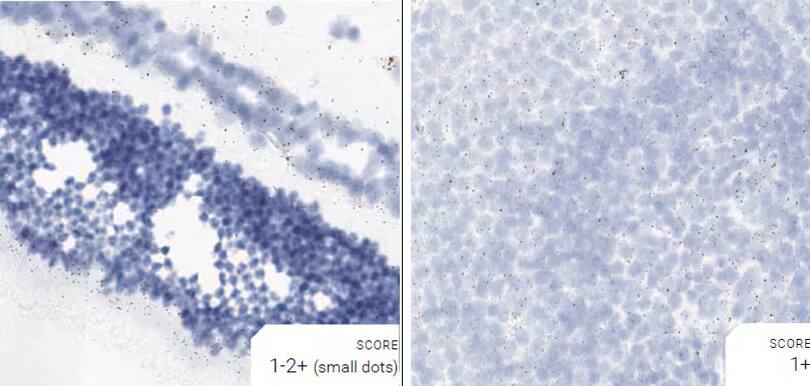
Image acquisition and data analysis
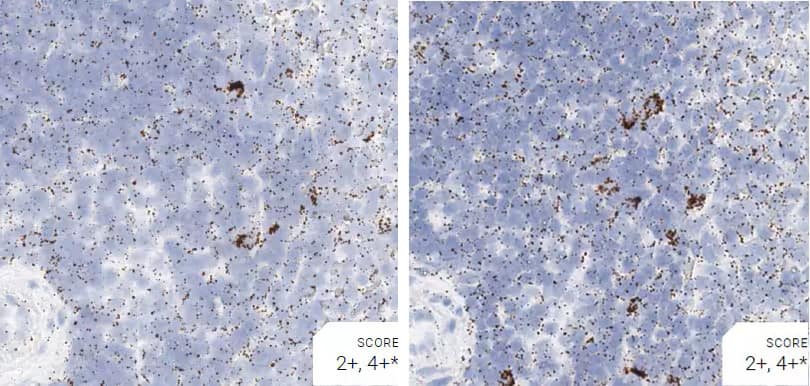
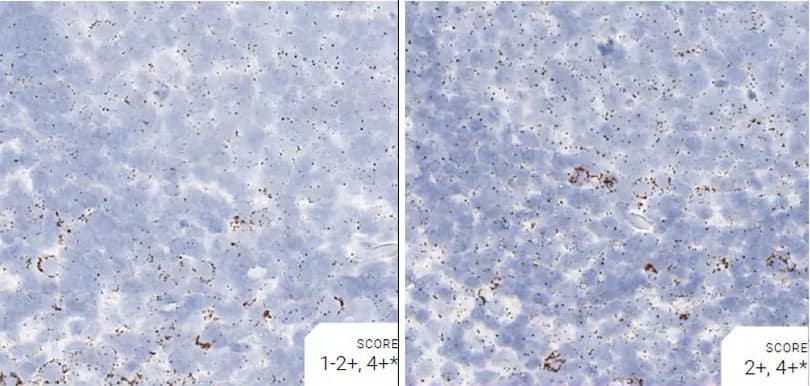
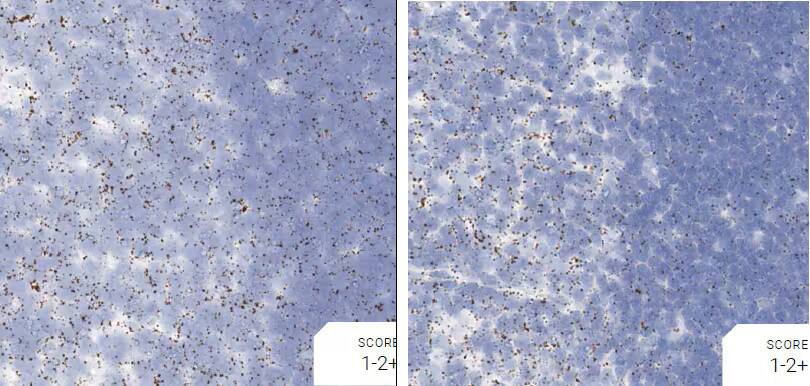
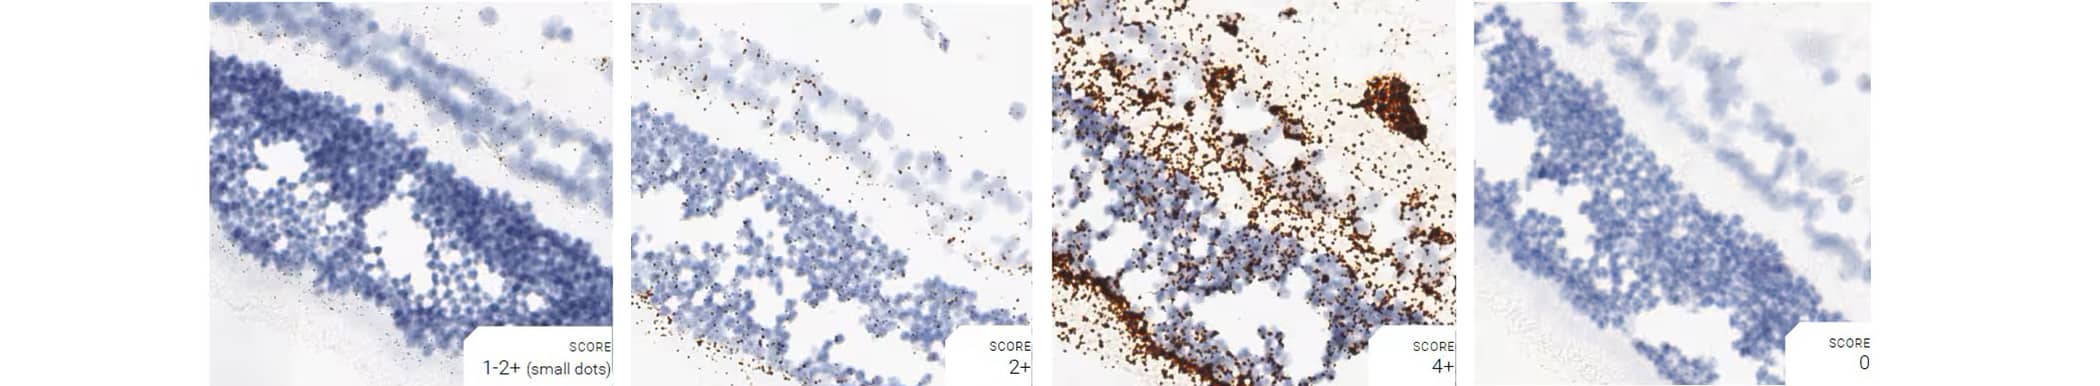
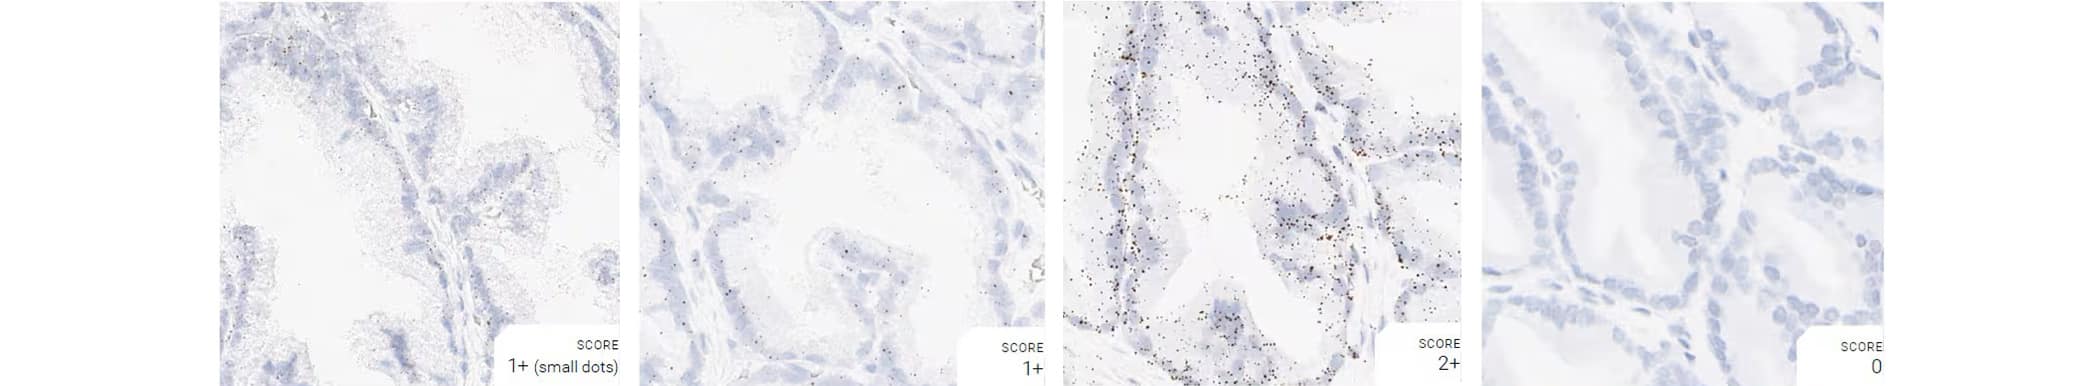
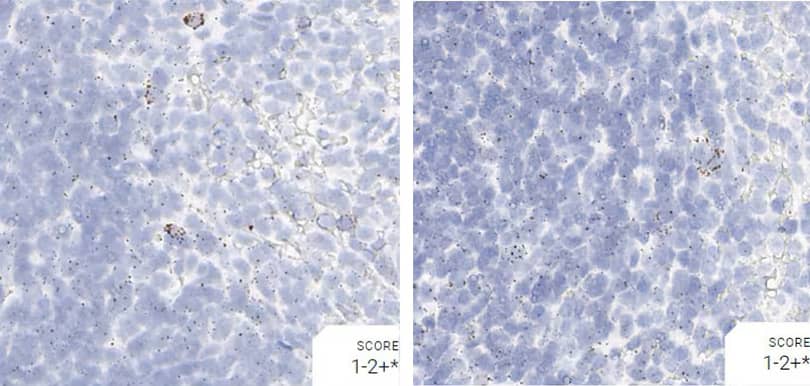
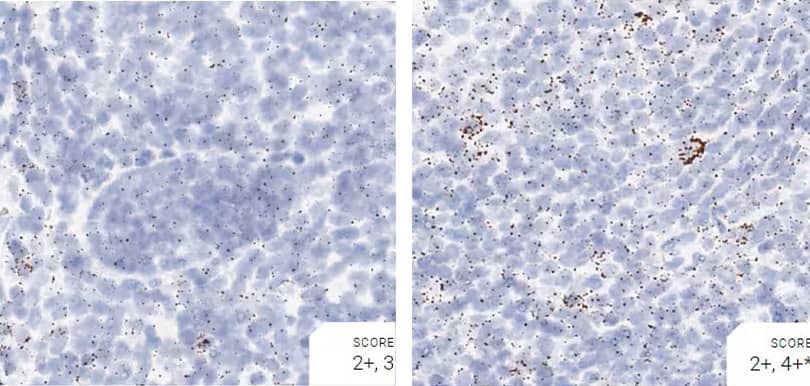
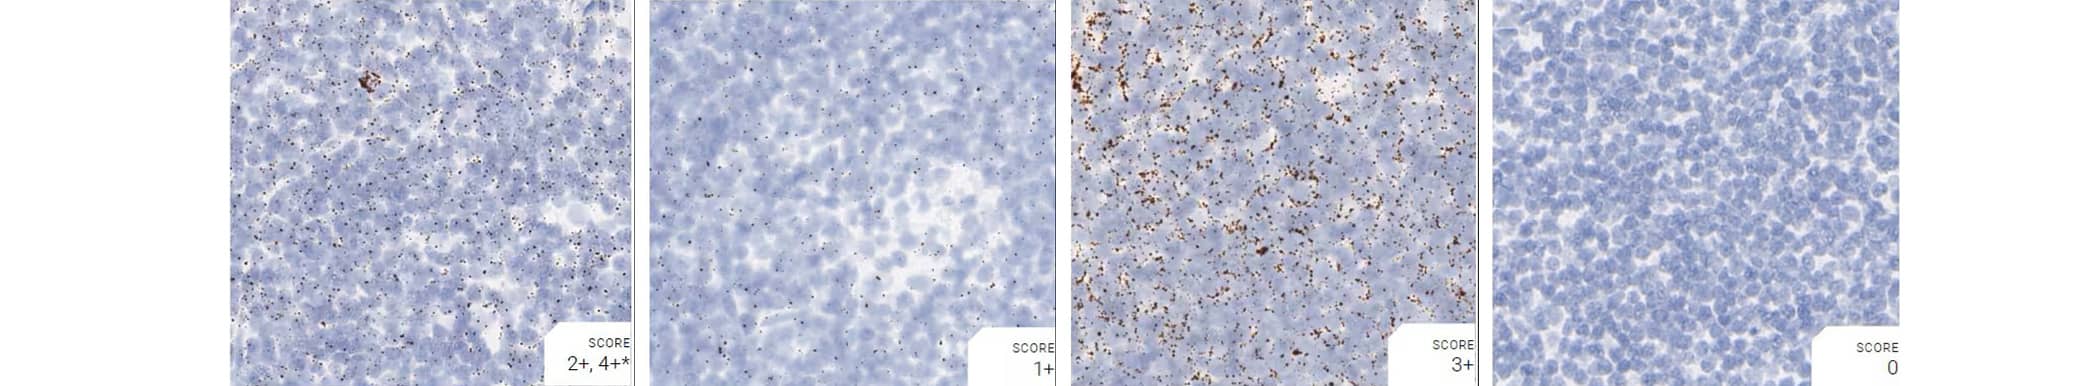
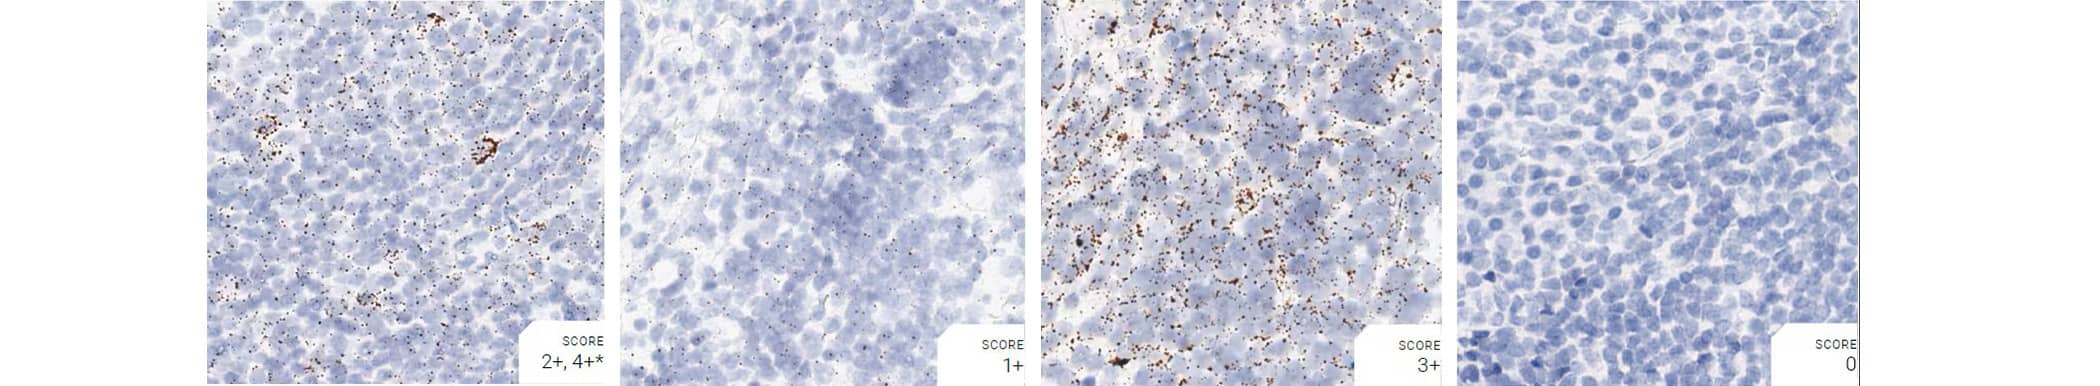
Images were acquired using a Leica Biosystems Aperio AT2 Digital Pathology Scanner, and RNA markers were analyzed based on the average RNA dot number per cell. RNA quantity was scored based on manual counting described as follows. Staining results were categorized into five grades according to the number of dots visualized under a bright-field microscope. 0: No staining or less than 1 dot to every 10 cells (40X magnification); 1+: 1-3 dots/cell (visible at 20-40X magnification); 2+: 4-10 dots/cell, very few dot clusters (visible at 20-40X magnification); 3+: >10 dots/cell, and less than 10% positive cells have dot clusters (visible at 20X magnification); and 4+: >10 dots/cell, and more than 10% positive cells have dot clusters (visible at 20X magnification). Figure 3 shows example of scoring for a variety of tissues, and Figure 6 (page 147) shows examples of gradual scoring.
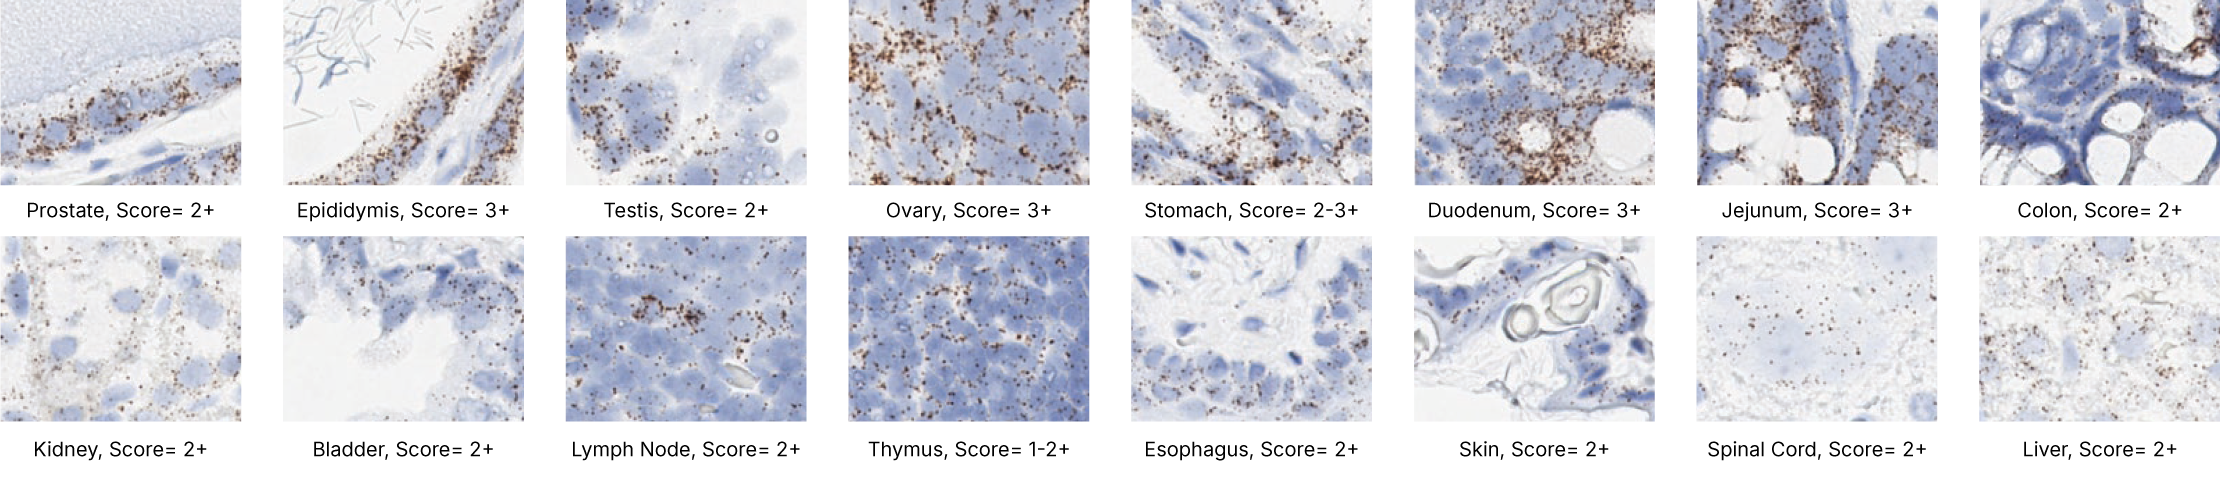
Figure 2. Representative images for tissue qualification using the control probe Rn-Ppib in multiple rat tissues.
Optimal Pretreatment Conditions for Different Tissues in Different Species
The standard protocol of RNAscope™ 2.5 LS Reagent Kit (on the Leica Biosystems’ BOND RX Research Advanced Staining System) is designed to work for the majority of FFPE tissues.
In the study, to achieve optimal detection of RNA molecules in each tissue type, two different pretreatment conditions were compared — standard and mild — with a modification to the epitope retrieval step (Figure 2).
Standard pretreatment
BOND Epitope Retrieval Buffer 2 (ER2) at 95°C for 15 min, followed by protease digestion at 40°C for 15 min.
Mild pretreatment
ER2 at 88°C for 15 min, followed by protease digestion at 40°C for 15 min.
The optimal pretreatment condition for each tissue type was determined based on RNA signal level and the integrity of morphology. Table 4 describes optimal conditions determined in this study for tissues from rat, dog, and cynomolgus monkey. Complete data with tissue images and recommended conditions for all samples are shown in section 2. The background signal, evaluated by the bacterial dapB probe, was very low or absent in all test samples with both pretreatment conditions. To optimize conditions for species other than rat, dog, and cynomolgus monkey, it is generally recommended to start with the default pretreatment setting, which is mild for lymphoid tissues and retina and standard for other tissues.
Positive control probe: Rn-Ppib
Tissue: Rat Spleen
Tissue: Rat Spleen
Pretreatment: Standard (left); Mild (right)
Observation: Loss of cell boundary using standard pretreatment.
Optimal pretreatment: Mild
Tissue: Rat Lymph Node
Tissue: Rat Lymph Node
Pretreatment: Standard (left); Mild (right)
Observation: Loss of cell boundary using standard pretreatment.
Optimal pretreatment: Mild
Tissue: Rat Thymus
Tissue: Rat Thymus
Pretreatment: Standard (left); Mild (right)
Observation: Loss of cell boundary using standard pretreatment.
Optimal pretreatment: Mild
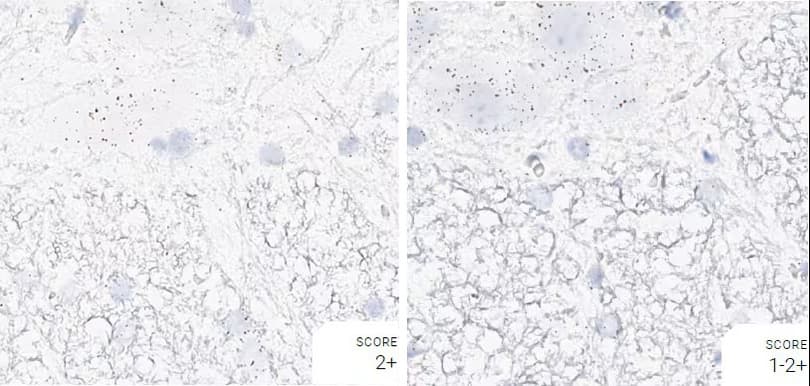
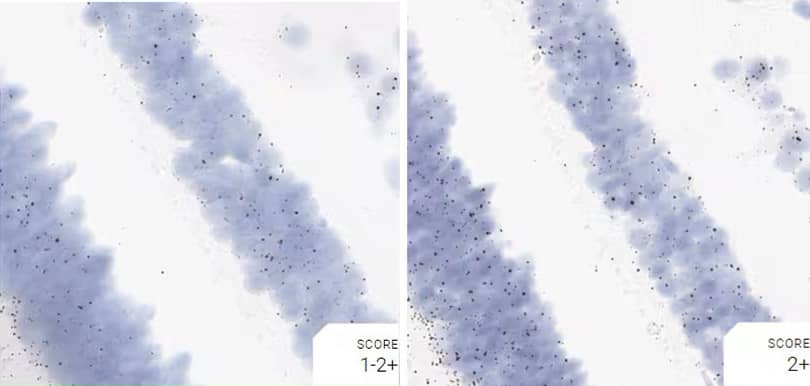
Tissue: Rat Spinal Cord
Tissue: Rat Spinal Cord
Pretreatment: Standard (left); Mild (right)
Observation: Standard pretreatment increases staining in white matter.
Optimal Pretreatment: Standard
Positive and negative control probe data using optimal conditions per tissue type
The following shows the three positive controls (Ppib, Polr2a, Ubc) and the negative control images using optimal pretreatment condition. Recommended positive control probe is indicated for each tissue type.
Tissue: Rat Spleen
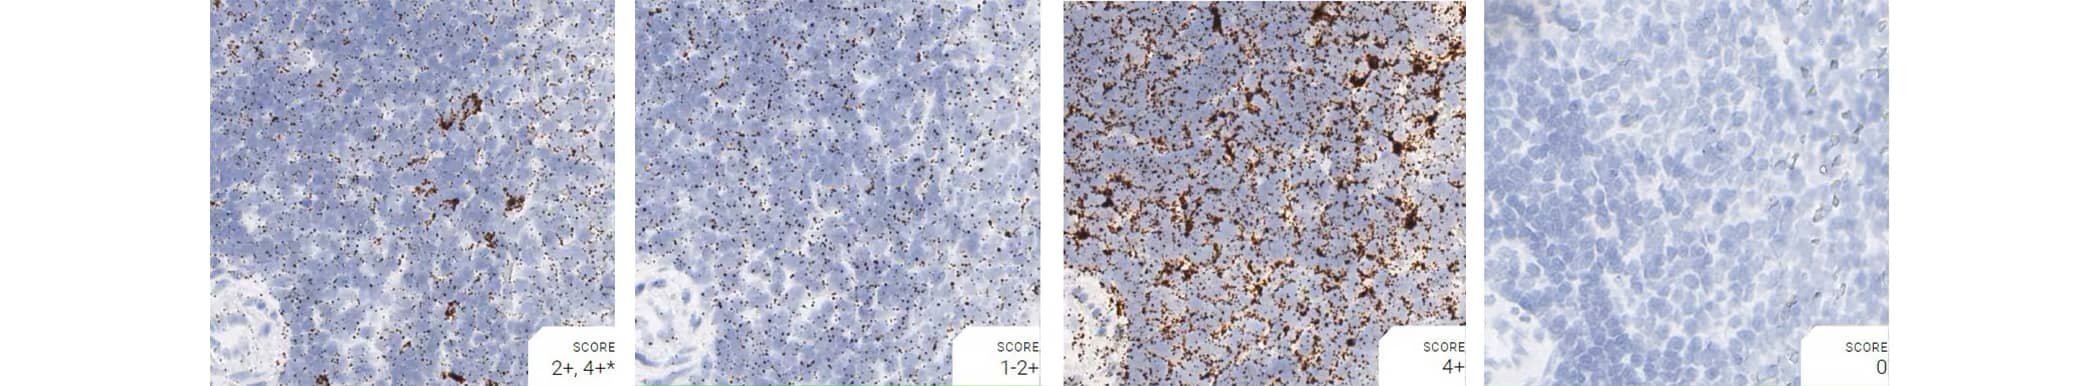
Pretreatment: Mild
Control Probes (from left to right): Rn-Ppib; Rn-Polr2a; Rn-Ubc; DapB
Observations: A few cells have higher Ppib signal. Rn-Polr2a staining is more evenly distributed
Recommended Positive Control Probe: Rn-Ppib/Rn-Polr2a
Tissue: Rat Lymph Node
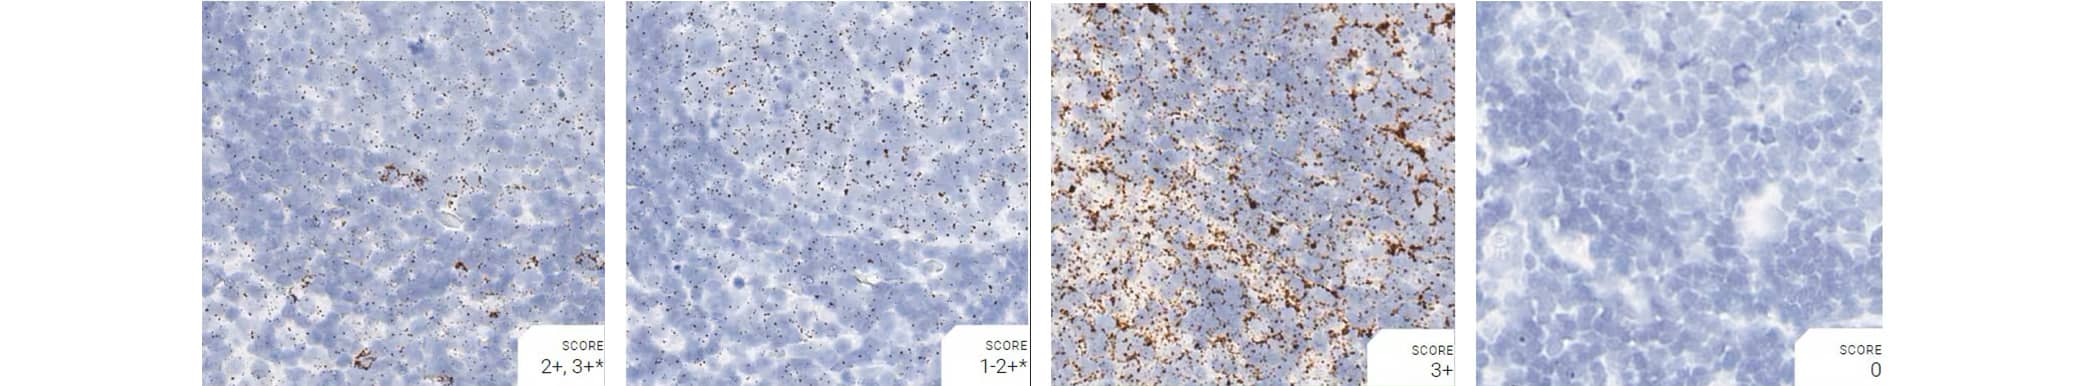
Pretreatment: Mild
Control Probes (from left to right): Rn-Ppib; Rn-Polr2a; Rn-Ubc; DapB
Observations: Rn-Polr2a staining is more evenly distributed
Recommended Positive Control Probe: Rn-Ppib/Rn-Polr2a
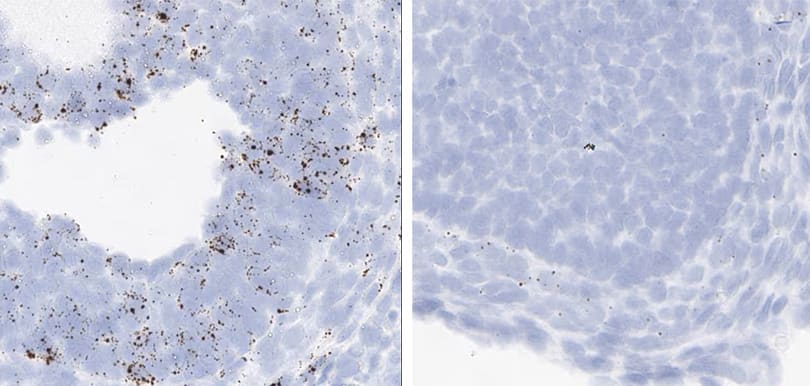
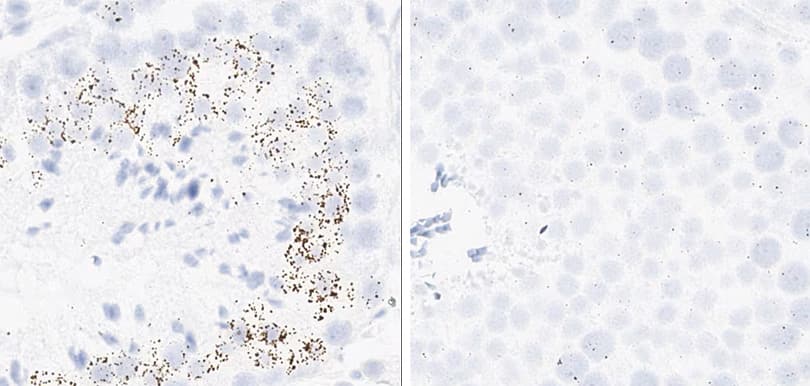
Proliferation and apoptosis markers per tissue type
The following shows proliferation and apoptosis marker images using the optimal pretreatment condition for each tissue.
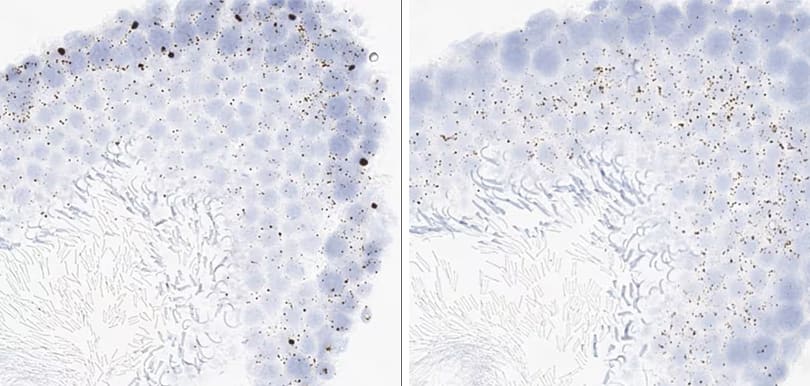
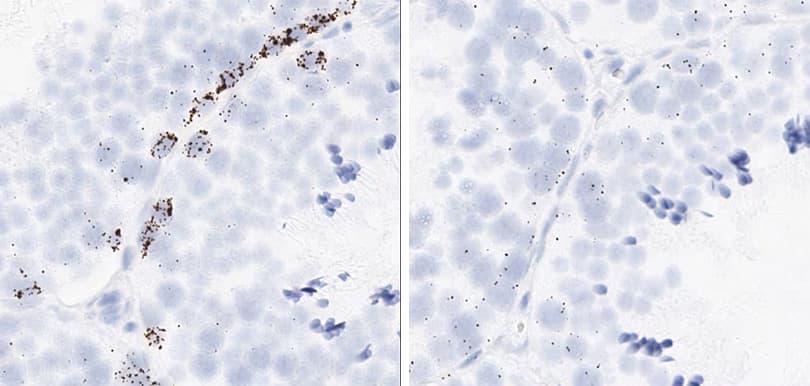
Tissue: Rat Testis
Tissue: Rat Testis
Target Probe: Rn-Mki67 (Ki-67) (left); Rn-Ccne1 (Cyclin E1) (right)
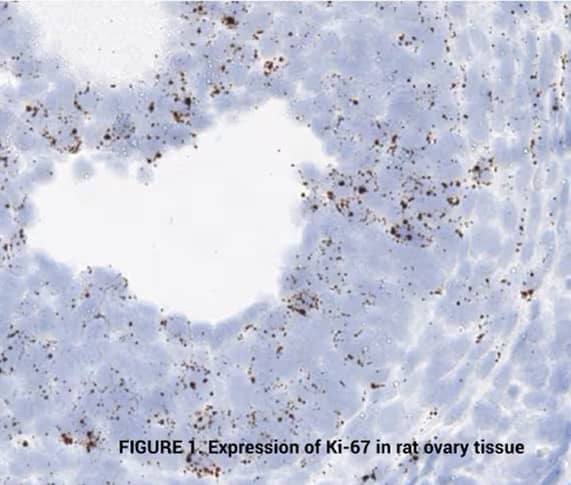
Tissue: Rat Ovary
Tissue: Rat Ovary
Target Probe: Rn-Mki67 (Ki-67) (left); Rn-Ccne1 (Cyclin E1) (right)
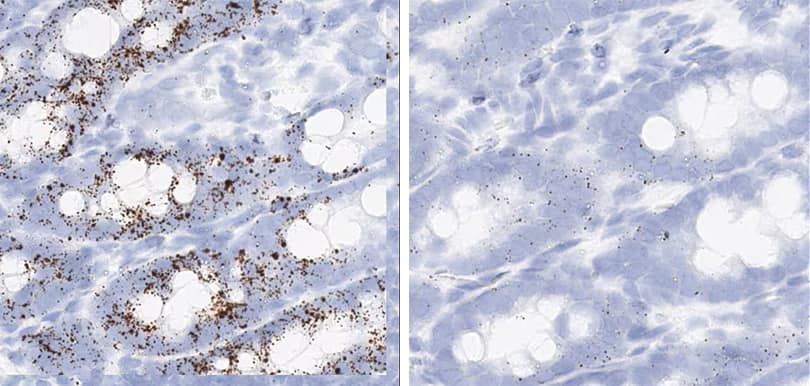
Tissue: Rat Duodenum
Tissue: Rat Duodenum
Target Probe: Rn-Mki67 (Ki-67) (left); Rn-Ccne1 (Cyclin E1) (right)
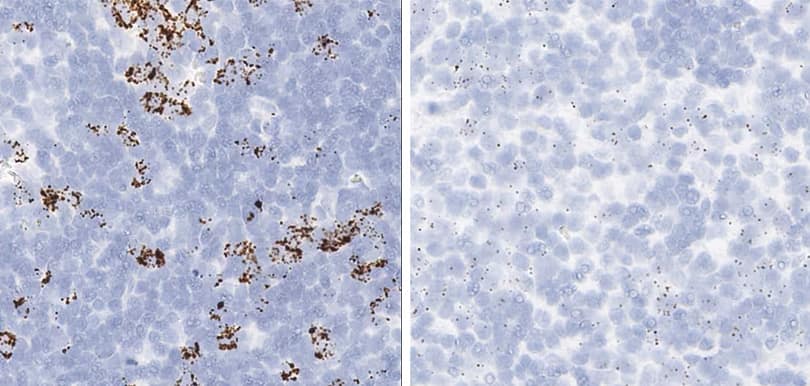
Tissue: Rat Lymph Node
Tissue: Rat Lymph Node
Target Probe: Rn-Mki67 (Ki-67) (left); Rn-Ccne1 (Cyclin E1) (right)
Positive control probe: Cl-POLR2A
Tissue: Dog Spleen
Tissue: Dog Spleen
Pretreatment: Standard (left); Mild (right)
Observation: Loss of cell boundary using standard pretreatment.
Optimal pretreatment: Mild

Tissue: Lymph Node
Tissue: Lymph Node
Pretreatment: Standard (left); Mild (right)
Observation: Loss of cell boundary using standard pretreatment.
Optimal pretreatment: Mild
Tissue: Dog Thymus
Tissue: Dog Thymus
Pretreatment: Standard (left); Mild (right)
Observation: Loss of cell boundary using standard pretreatment.
Optimal pretreatment: Mild
Tissue: Dog Retina
Tissue: Dog Retina
Pretreatment: Standard (left); Mild (right)
Observation: Standard pretreatment causes more cell detachment and reduced signals.
Optimal pretreatment: Mild
Positive and negative control probe data using optimal conditions per tissue type
The following shows the three positive controls (Ppib, Polr2a, Ubc) and the negative control images using optimal pretreatment condition. Recommended positive control probe is indicated for each tissue type.
Tissue: Dog Retina
Pretreatment: Mild
Control Probes (from left to right): Cl-Ppib; Cl-Polr2a; Cl-Ubc; DapB
Recommended Positive Control Probe: Cl-Polr2a
Tissue: Dog Prostate Gland
Pretreatment: Mild
Control Probes (from left to right): Cl-Ppib; Cl-Polr2a; Cl-Ubc; DapB
Recommended Positive Control Probe: Cl-Polr2a
Proliferation and apoptosis markers per tissue type
The following shows proliferation and apoptosis marker images using the optimal pretreatment condition for each tissue.
Tissue: Dog Testis
Tissue: Dog Testis
Target Probe: Cl-MK167 (Ki-67) (left); Cl-CCNE1 (Cyclin E1) (right)
Tissue: Dog Lymph Node
Target Probe: Cl-MK167 (Ki-67) (left); Cl-CCNE1 (Cyclin E1) (right)
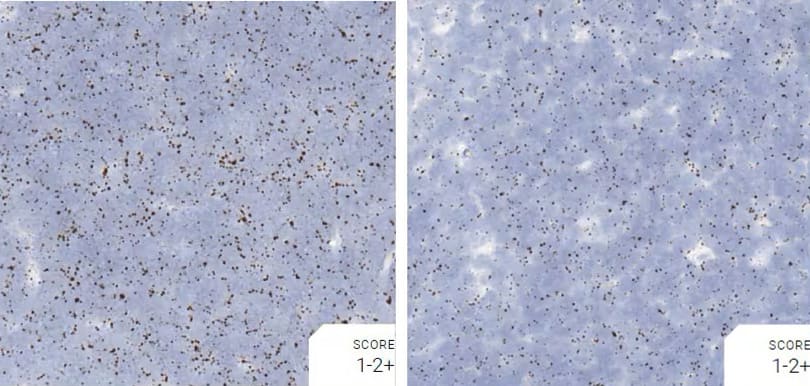
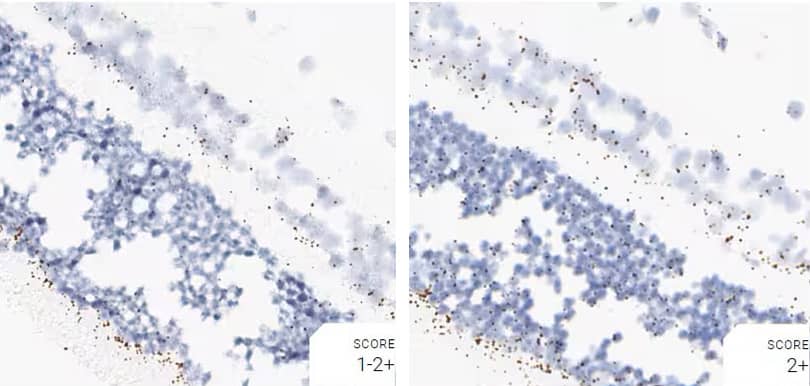
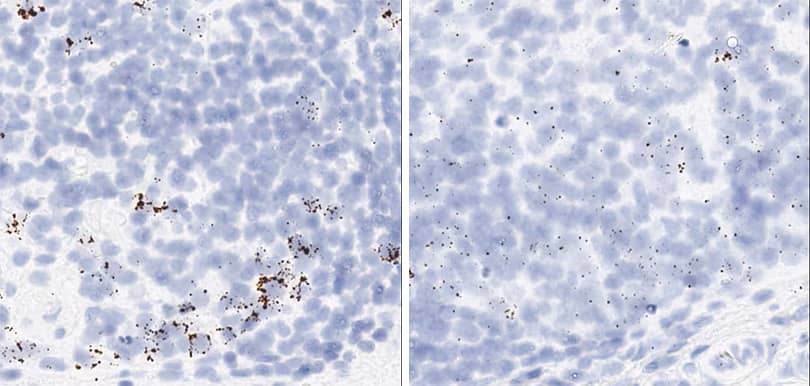
Positive control probe: Hs-PPIB
Tissue: Monkey Spleen
Tissue: Monkey Spleen
Pretreatment: Standard (left); Mild (right)
Observation: Loss of cell boundary using standard pretreatment. A few cells have higher PPIB signal.
Optimal Pretreatment: Mild

Tissue: Monkey Lymph Node
Tissue: Monkey Lymph Node
Pretreatment: Standard (left); Mild (right)
Observation: Loss of cell boundary using standard pretreatment. A few cells have higher PPIB signal. Signal: Mild ≥ Standard.
Optimal pretreatment: Mild
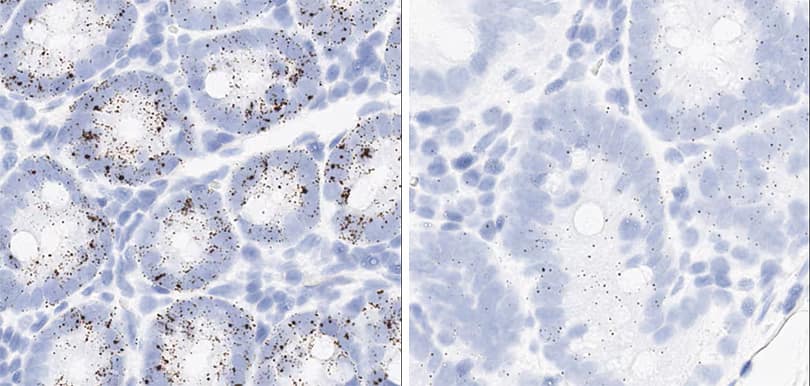
Tissue: Monkey Tonsil
Tissue: Monkey Tonsil
Pretreatment: Standard (left); Mild (right)
Observation: Loss of cell boundary using standard pretreatment. Under mild pretreatment a few cells have higher PPIB signal. Signal: Mild ≥ Standard.
Optimal pretreatment: Mild
Positive control probe: Hs-POLR2A
Tissue: Monkey Retina
Tissue: Monkey Retina
*Retina expresses low levels of PPIB
Pretreatment: Standard (left); Mild (right)
Observation: Loss of cell boundary using standard pretreatment. Signal: Mild ≥ Standard.
Optimal pretreatment: Mild
Positive and negative control probe data using optimal conditions per tissue type
The following shows the three positive controls (Ppib, Polr2a, Ubc) and the negative control images using optimal pretreatment condition. Recommended positive control probe is indicated for each tissue type.
Tissue: Monkey Lymph Node
Pretreatment: Mild
Control Probes (from left to right): Hs-PPIB; Hs-POLR2A; Hs-UBC; DapB
Recommended Positive Control Probe: Hs-PPIB/Hs-POLR2A*
*Hs-POLR2A staining is more evenly distributed
Tissue: Monkey Tonsil
Pretreatment: Mild
Control Probes (from left to right): Hs-PPIB; Hs-POLR2A; Hs-UBC; DapB
Recommended Positive Control Probe: Hs-PPIB/Hs-POLR2A*
*Hs-POLR2A staining is more evenly distributed
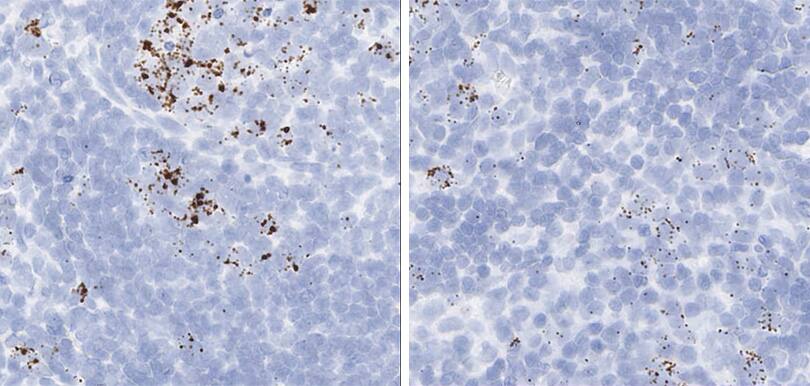
Proliferation and apoptosis markers per tissue type
The following shows proliferation and apoptosis marker images using the optimal pretreatment condition for each tissue.
Tissue: Monkey Testis
Tissue: Monkey Testis
Target Probe: Hs-MK167 (Ki-67) (left); Mfa-CCNE1 (Cyclin E1) (right)

Tissue: Monkey Ovary
Tissue: Monkey Ovary
Target Probe: Hs-MK167 (Ki-67) (left); Mfa-CCNE1 (Cyclin E1) (right)
Tissue: Monkey Tonsil
Tissue: Monkey Tonsil
Target Probe: Hs-MK167 (Ki-67) (left); Mfa-CCNE1 (Cyclin E1) (right)
Tissue: Monkey Duodenum
Tissue: Monkey Duodenum
Target Probe: Hs-MK167 (Ki-67) (left); Mfa-CCNE1 (Cyclin E1) (right)
3. Troubleshooting
3.1 Sample preparation and optimization
The most common reason for subpar results with the RNAscope assay is suboptimal sample preparation. Wherever possible, tissues should be prepared according to standard methods:
- Tissue specimens should be fixed in fresh 10% NBF for 16-32 h at room temperature and blocked into a thickness of 3-4 mm.
- Dehydrate in a graded series of ethanol and xylene, followed by infiltration with melted paraffin held at no more than 60°C.
- Trim paraffin blocks as needed and cut embedded tissue into 5 ±1 μm sections using a microtome.
- Place paraffin ribbon in water bath, and mount sections on Superfrost® Plus Slides.
- Air-dry slides overnight at room temperature. Do not bake slides unless they will be used within one week.
In many situations information on tissue preparation procedures may be unavailable. Tissue optimization steps depend not only on the type of tissue, but also the age of the sample. Optimal conditions are dependent on tissue type, age, and fixation. Simple optimization steps can help obtain quality data.
If sample preparation conditions do not match recommended guidelines or are unknown, qualifying samples prior to performing any experiments is strongly recommended.
NOTE: Under-fixation will result in significant RNA loss during storage and may result in low signal when performing the RNAscope assay.
3.2 Unexpected staining patterns
Unexpected staining patterns are commonly due to suboptimal digestion conditions. Generally speaking, over-fixed or under-digested tissue will have excellent tissue morphology with weak/no signal and low signal/background ratio due to poor probe accessibility to RNA.
Under-fixed or over-digested tissue will have poor tissue morphology (tissue appears faded with loss of cell borders) and loss of RNA due to protease over-digestion. Use below examples of unexpected staining patterns to determine if your sample is under- or over-digested.
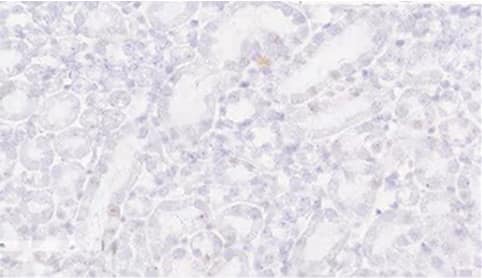
Under-digested Tissue
Morphology Description: Excellent morphology, strong hematoxylin staining
Possible effects: Weak/no signal due to poor probe accessibility to RNA
Problem
Problem
Pretreatment conditions not optimal
- Tissue is over-digested
- Tissue is under-digested
Image shows standard pretreatment (15 min target retrieval + 30 min protease) on Mm kidney
Solution
Solution
Optimize pretreatment conditions
- Decrease boiling and/or protease if tissue is over-digested
- Increase boiling and/or protease if tissue is under-digested
Image shows optimized preatreatment (7 min target retrieval + 30 min protease) on Mm kidney
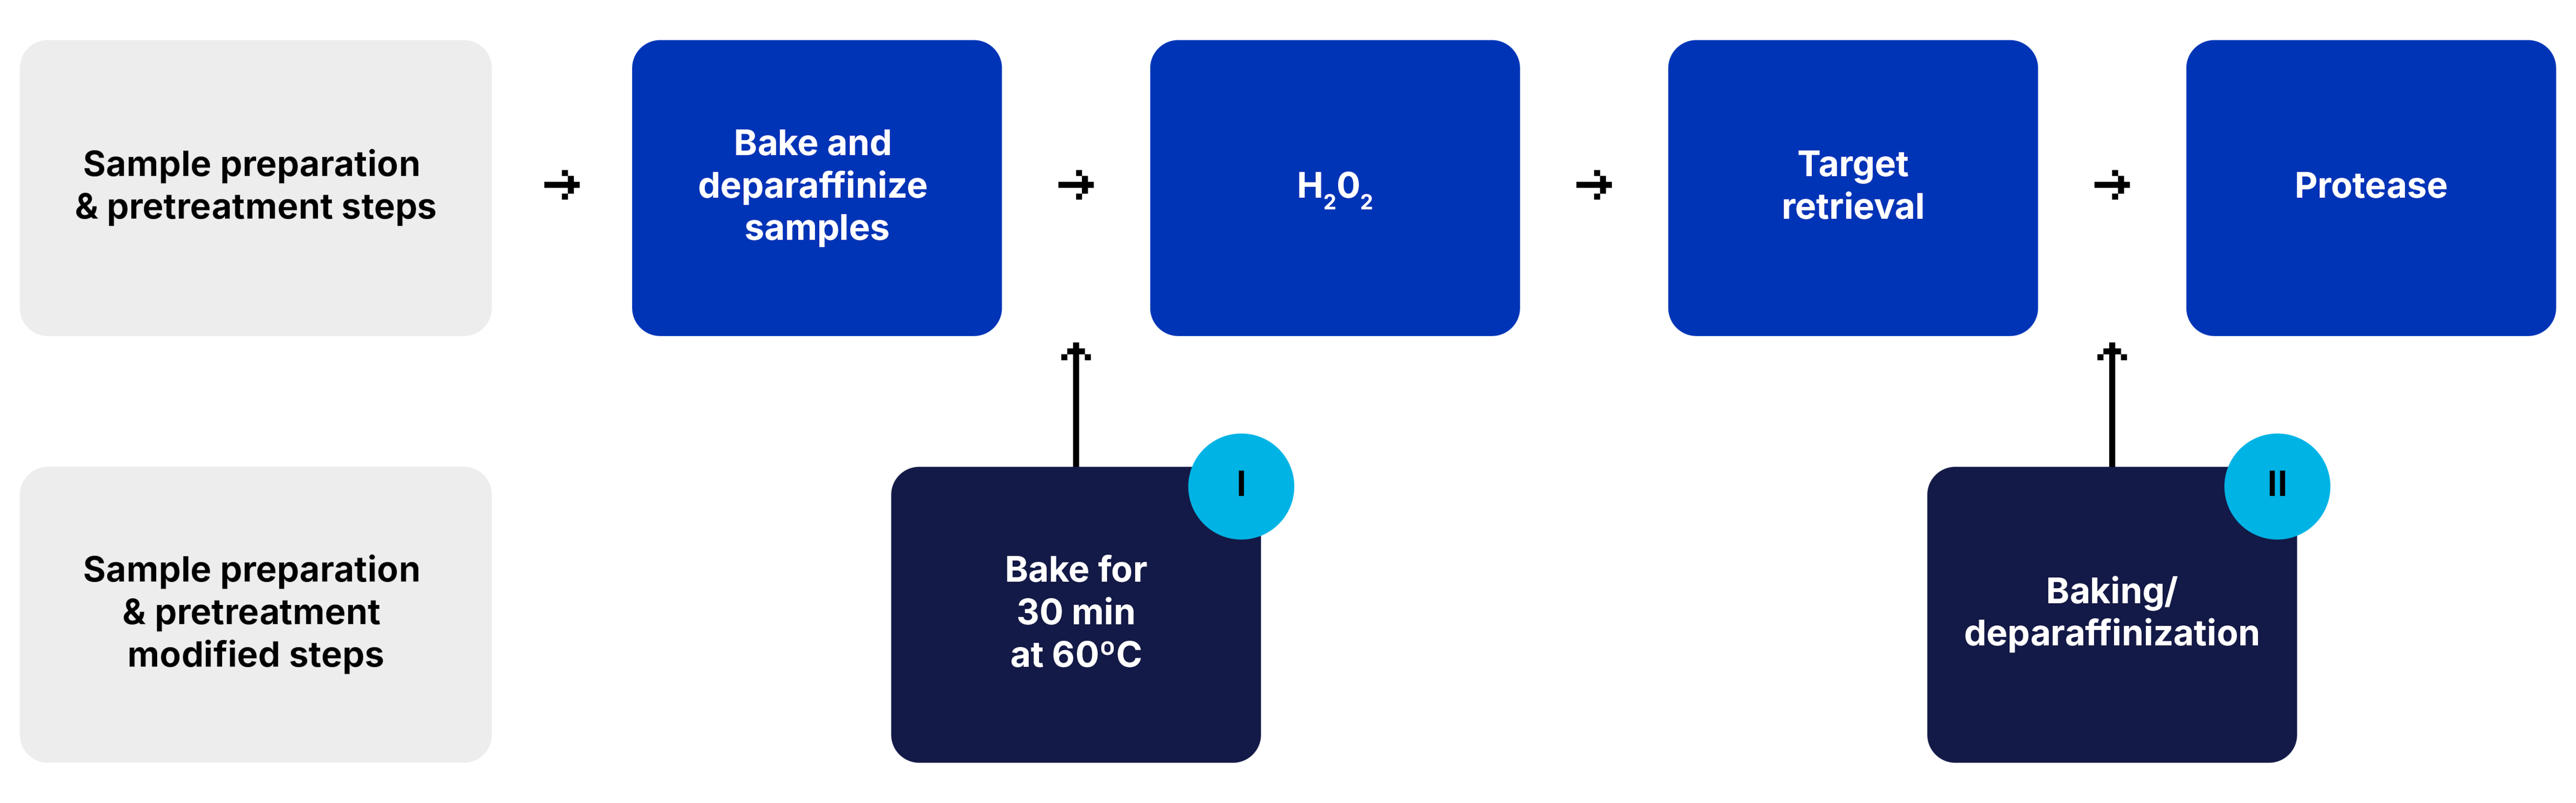
FFPE Samples
For FFPE samples additional baking steps are added to the sample preparation workflow.
For sample detachment after the baking/deparaffinizaton step or after target retrieval step, a baking step is added for 30 min at 60°C (I) or (II), respectively.
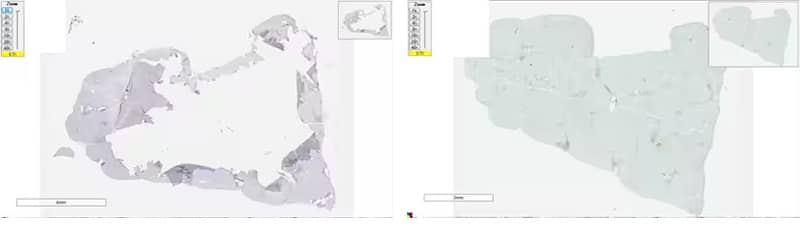
Before- Suboptimal tissue preparation (left)
After - Baked for 1 h at 60°C (right)
- Prepare tissue samples according to recommended procedures
- Bake slides for a longer time (up to overnight)
- Reduce boiling time
Tips for troubleshooting tissue detachment in FFPE samples:
- Always use Superfrost Plus Slides® (Fisher Scientific, Cat #12-550-15)
- Bake/dry slides in active air circulating oven (NOT HybEZ™ oven)
- Maintain mild boiling of target retrieval at ~100°C.
3.5 Other issues
Successful implementation of the RNAscope™ assay is directly linked to hybridization environment. The ACD HybEZ™ Hybridization System and its ability to accurately keep the temperature stable is essential to success of the RNAscope™ assay.
The HybEZ™ Oven is a simple, easy-to-use, low-profile benchtop hybridization oven that provides superior conditions for RNA-ISH, and is the only hybridization oven for which ACD can provide our customers with our RNAscope™ assay performance guarantee. The HybEZ™ Oven provides a gasket-sealed, temperature-controlled humidifying chamber necessary for optimized RNAscope™ assay performance.
No staining observed
Problem - Hybridization conditions not optimal
Solution - Use HybEZ™ Hybridization System
Corrected Staining - No staining or less than 1 dot to every 10 cells