FAQs - LC3 and Autophagy
Find scientific technical answers on frequently asked questions (FAQs) relating to:
- Autophagy signaling markers
- LC3 Western blot troubleshooting
- Significance of LC3-I/LC3-II ratio
- How to interpret LC3 immunoblotting
- Chloroquine-based positive controls
- Autophagy-inducing peptides
- ICC/IF and IHC staining of LC3
- Anti-LC3B and anti-p62/SQSTM1
- Analysis of autophagy flux markers
- Autophagy inhibitors and inducers
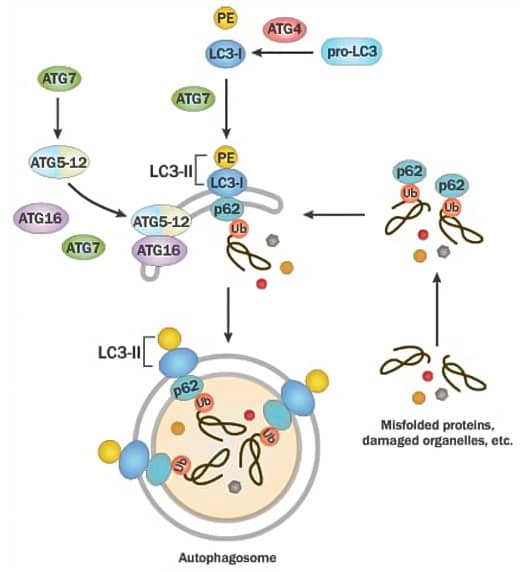
Atg4 cleaves pro-LC3 to form LC3-I which then gets conjugated to PE (by Atg7) for the generation of LC3-II. The latter gets recruited to the autophagosomal membrane for helping membrane elongation. ATG7 also mediates ATG5-ATG12-ATG16 complex formation and the latter along with LC3-II is highly critical for autophagosome formation. Adaptor protein p62/SQSTM1 binds to ubiquitinated proteins and LC3-II for mediating autophagy via localizing into autophagic compartments, transporting ubiquitinated proteins and organelles for degradation.
|
Several molecular markers of autophagy have been studied to date but the conversion of LC3-I to LC3-II via phosphatidylethanolamine (PE) conjugation has been accepted as the gold standard for autophagosome formation. p62/SQSTM1 is also important since it is a substrate for LC3 which facilitates selective degradation during autophagy. Some of the major proteins involved in autophagy signaling are:
What is LC3 and how is it related to or different from Atg8?LC3 was originally identified as a subunit of microtubule-associated proteins 1A and 1B (MAP1LC3) and was subsequently found to have similarities to the yeast protein Atg8 (also called Apg8, Aut7 or Cvt5). The mammalian homologues of yeast are subdivided into two major subfamilies: MAP1LC3/LC3 (LC3A, LC3B and LC3C) and GABARAP (GABARAP, GABARAPL1 and GABARAPL2/GATE-16). Both LC3 and GABARAP are expressed as precursor proteins which undergo cleavage followed by lipidation/PE-conjugation to generate LC3-II and GABARAP–PE respectively. Besides GABARAPL2, it has been documented that all mammalian Atg8 homologues play a role in autophagosome biogenesis. Furthermore, because of unique features in the distribution of their molecular surface charges, it has been suggested that LC3 and GABARAP recognize distinct sets of cargoes for selective autophagy.
What is the difference between LC3A, LC3B and LC3C, or LC3-I and LC3-II?LC3 is a soluble protein with a molecular mass of ∼17 kDa and is distributed ubiquitously in eukaryotes. It is expressed as the splice variants LC3A, LC3B, and LC3C which display unique tissue distribution. All LC3 isoforms undergo post-translational modifications, especially PE conjugation (lipidation) during autophagy. Upon autophagic signal, the cytosolic form of LC3 (LC3-I) is conjugated to PE to form LC3-PE conjugate (LC3-II), which is recruited to the autophagosomal membranes.
What is the significance of LC3-I and LC3-II, and which immunoassay is the best for distinguishing them from each other?After its translation, the unprocessed form of LC3 (pro-LC3) is proteolytically cleaved by Atg4 protease, resulting in the formation of LC3-I form with a carboxyterminal exposed glycine. Upon autophagic signal, LC3-I is conjugated by Atg7 (an E1-like activity), Atg3 (an E2-like conjugating activity) and Atg12-Atg5-Atg16L multimers (E3-like ligase activity) to a PE moiety for the generation of LC3-II form. It is the lipophilic character of PE group which facilitates the insertion of LC3-II into the membranes of autophagosomes, and subsequently, LC3-II protein is degraded when the autophagosomes fuse with lysosomes. LC3-II, especially LC3B-II, is the only well-characterized protein which is specifically localized to autophagic structures throughout the process from phagophore to lysosomal degradation. Although larger in molecular mass, LC3-II shows faster electrophoretic mobility in SDS-PAGE gels (potentially because of increased hydrophobicity). LC3-II shows up at 14-16 kDa in comparison to 16-18kDa for LC3-I. LC3-I and LC3-II's differential mobility helps in their detection/characterization in Western blot (WB) assay and the conversion of LC3-I to the lower migrating form LC3-II has been used as an indicator of autophagy in countless studies. In immunocytochemistry/immunofluorescence (ICC/IF) and immunohistochemistry (IHC), LC3-I pool generates a diffused signal while the LC3-II is observed as punctate staining representing the autophagosomes. In autophagy experiments, the best approach is to detect LC3 in Western blotting and to correlate the LC3-I/LC3-II ratios to the number of autophagosomes or the cells positive for autophagosome punctas. |
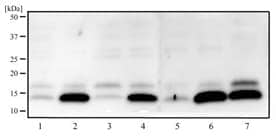
WB analysis of HeLa (1), HeLa + Chloroquine/CQ (2), SHSY5Y (3), SHSY5Y +CQ (4), A431 (5), A431 +CQ (6) and Ntera2 (7) using rabbit polyclonal LC3 antibody at 2 ug/ml concentration.
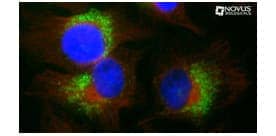
LC3B Antibody (clone 1251A) [NBP2-46892]
ICC/IF of CQ treated HeLa cells using LC3B (NBP2-46892) and Tubulin (NB100-690) antibodies with detection via Dylight 488 (green) and Dylight 550 (red) labelled secondaries respectively. Nuclei were counterstained with DAPI (blue).
Is it possible to distinguish LC3-I and LC3-II pools in immunostaining assays with two different fluorescent labelled antibodies?
No, because the main difference between LC3-I and LC3-II is their lipidation status (the conjugated PE moiety), all commercially available LC3 antibodies are known to detect both forms. To our knowledge, antibodies detecting only one isoform do not exist.
When doing Western blot of LC3, what percentage gel should be selected for its effective separation?
The predicted molecular weight of LC3 is ~17kDa and the processed forms LC3-I/II show up between 14-18kDa in WB analysis. For an effective separation of the two forms, we recommend using a 16% or a 4-20% gradient gel. If running a 16% gel, ensure the gel is not over-run. The LC3 protein may run off the gel due to its fast mobility/low molecular weight. Using a lower gel percentage, loading high sample amounts, and running the gel at high voltage may result in inappropriate separation/over-lapping of LC3-I and LC3-II bands, which makes it very difficult to distinguish between the two target bands and complicates data interpretation.
Are there any tips for the transfer step in Western blot assay of LC3?
After running step, equilibrate the gel in transfer buffer properly to remove the entire running buffer from the gel. Importantly, ensure not to add even traces of SDS to the transfer buffer. Some researchers find it better to use PVDF membrane compared to nitrocellulose membrane for LC3 detection. When choosing a membrane, a pore size of 0.2 um is recommended. Because LC3 is a significantly small protein, membranes with a pore size of 0.45 um should not be used (LC3 may cross through the membrane). Voltage /current for the transfer should be kept low and an extended transfer should also be avoided to prevent the target protein from crossing the membrane. After performing the transfer, one should use Amido black or Ponceau S staining to visulize protein transfer and to ensure that the proteins have actually transferred in the low molecular weight region (15-20kDa range).
What is the best blocking buffer for LC3 Western blot assay?
In our antibody validation assays, the conditions we have had the most success with are 5% non-fat dry milk in TBST as the blocking buffer. We suggest at least 1 hour of blocking on a slow shaker at room temperature. The blocking buffer should be prepared fresh because old blocking buffer (with potential microbial contamination) may lead to problems such as high background or the appearance of large dots on the blot.
What positive control may I use for Western blot of LC3?
Bio-Techne offers ready to use HeLa Chloroquine Treated / Untreated Cell Lysate (NBP2-49689) and Neuro2a Chloroquine Treated / Untreated Cell Lysate (NBP2-49688) which are highly recommended positive controls for WB assay of LC3. Overexpression lysates of LC3 such as NBP2-04906, or a total cell lysate from serum starved cells depicting excessive vacuolization are other options for use as positive control when performing LC3 WB analysis.
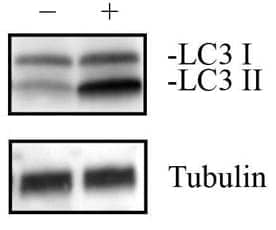
Neuro2a Chloroquine Treated / Untreated Cell Lysate [NBP2-49688]
- Neuro2A cells (mouse neuroblastoma) were treated with (+) and without (-) 50 uM Chloroquine overnight. Approximately 10 ug of each whole cell lysates in 1x Laemmli sample buffer (NBP2-49688) was separated on a gradient gel by SDS-PAGE, transferred to 0.2 um PVDF membrane and blocked in 5% non-fat milk in TBST. The membrane was probed with 1 ug/ml anti-LC3 antibody (NB100-2220) and 1 ug/ml anti-alpha tubulin (NB100-690), and detected with the appropriate secondary antibodies using chemiluminescence.
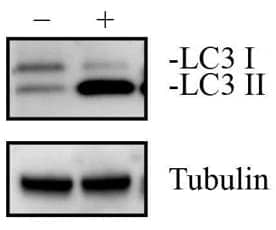
HeLa Chloroquine Treated / Untreated Cell Lysate [NBP2-49689]
– HeLa cells (human cervical carcinoma) were treated with (+) and without (-) 50 uM Chloroquine overnight. Approximately 10 ug of each whole cell lysates in 1x Laemmli sample buffer (NBP2-49689) was separated on a gradient gel by SDS-PAGE, transferred to 0.2 um PVDF membrane and blocked in 5% non-fat milk in TBST. The membrane was probed with 1 ug/ml anti-LC3 (NB100-2220) and 1 ug/ml anti-alpha tubulin (NB100-690), and detected with the appropriate secondary antibodies using chemiluminescence.
How long should the cells be serum starved for inducing autophagy?
Depending upon the cell type, serum starvation may take from a few hours to up to two days to induce autophagy. However, subjecting the cells to media such as Earle's Balanced Salt Solution or Hank's Balanced Salt Solution can induce autophagy in time points ranging from a few minutes to a couple of hours. The key would be to observe the cells for morphological changes, and the appearance of a large number of vacuoles in the cells is a good indicator of induction of autophagic death.
I do not see LC3-II band in my blot. How do I fix this problem?
LC3-II expression correlates with autophagy induction and will only be detected when significant autophagic activity is present in the samples being tested. Before producing lysates from cultured cells, be sure to look for morphological changes which are characteristics of autophagic death (especially the excessive vacuolization). If working on tissues, it should be noted that autophagic cells are cleared more rapidly in vivo, and inclusion of autophagic flux blockage-based positive control (such as NBP2-49688 or NBP2-49689) can be helpful in the analysis of the extent of autophagic activity in the tissues under investigation.
My control samples also show very high levels of LC3II. What does it signify?
Some cell lines may have higher basal levels of autophagy than others and in those cases, the control sample will show high levels of LC3-II. Excessive starvation before treatments of interest may also lead to the detection of high levels of LC3-II in control samples.
In Western blot analysis, I can visualize the loading control bands, but I do not see any bands for LC3. Is there something wrong with my primary antibody?
It can be a problem related to the primary antibody as well, but before drawing that conclusion, one may consider some other potential reasons also. Prior to making the lysates from cultured cells, make sure to look at the morphology of the cells to confirm if autophagy is being induced or not (excessive vacuolization is a good indicator of autophagy). Use 4-20% gel for separation and do not run the gel at a high voltage. The pore size of the transfer membrane should be ~ 0.2 um, and the transfer buffer should not contain SDS. After transfer, use Amido black or Ponceau S staining to see if you have proteins transferred in the low molecular weight region (15-20kDa range). In order to provide optimum temperature/time for antigen-antibody interaction, perform the primary incubation at room temperature for a couple of hours followed by overnight incubation at 4°C.
Besides LC3-I/II bands, I see a signal above ~40kDa also in my samples. Is it a non-specific band or potentially a dimer of LC3?
In literature, the LC3 homolog GABARAP has been shown to assume a dimeric conformation which is required for it to bind to microtubules and GABA receptors (Nymann-Andersen et al. 2002). Baisamy et al. 2009 demonstrated that FLAG- and GFP-tagged LC3 are able to co-immunoprecipitate from HEK-293 cell lysates, suggesting that LC3 can form oligomers inside cells. They further proposed that in this configuration, LC3 binding could promote a conformational change that impacts the Rho-GEF activity of AKAP-Lbc. Therefore, we believe that in LC3 blots, the bands that run above 40 kDa position might be originating from the potential dimeric/oligomeric forms of LC3.
What is autophagic flux and how is it helpful in autophagy studies?
Autophagic flux represents the dynamic process of autophagosome generation, their fusion with lysosomes, and the degradation of autophagic substrates in autolysosomes. LC3-II quantification generally correlates to autophagosome numbers, but may not act as an indicator of autophagy activity levels in all cases. Instead, autophagic flux is considered a more reliable indicator of autophagic activity than measurement of autophagosome numbers. For example, the accumulation of autophagosomes may also represent the increased formation of autophagosomes and/or a block in autophagosomal maturation/completion of autophagy, and performing the autophagic flux assays provides an option to distinguish between these two conditions. Inhibitors such as Bafilomycin A1, Chloroquine, and Pepstatin A/E64d inhibits the autolysosome contents degradation via inhibition of the Na+/H+ pump at the lysosome, increasing lysomal pH and inhibiting acidic lysosomal proteases, respectively. In the presence of such inhibitors, accumulation of LC3-II-positive autophagosomes demonstrates efficient autophagic flux, while a failure of LC3-II protein to increase in the presence of such agents indicates a defect or delay earlier in the process, prior to degradation at the autolysosome. NH4Cl (20-40 uM) is another useful agent that blocks lysosomal degradation and is helpful in estimating the relative contribution of the lysosomal vs non-lysosomal pathway to the process of protein degradation. 3-Methyladenine (3-MA) is another useful agent which (at a concentration of 5 mM) inhibits autophagy by blocking autophagosome formation/fusion via the inhibition of PI3K. An alternative method for study of the autophagic flux is by measuring p62/SQSTM1 degradation because p62/SQSTM1 binds LC3, thus serving as a selective substrate of autophagy. Experimentally, p62/SQSTM1 levels have been shown to decrease during starvation in wild-type MEFs, but not in Atg5 -/- MEFs, suggesting that the reduction is mediated by autophagy. Because the expression level of p62/SQSTM1 can also change independent of autophagy, a combination of p62 levels along with LC3 as well as the autophagosomes numbers would be the most rational approach for autophagy detection.
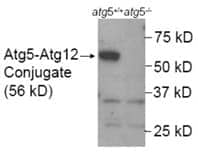
ATG5 Antibody [NB110-53818] WB analysis of lysates from wild-type mouse embryonic stem/ES cells (atg+/+) and the ATG5 knockout mouse's ES cells (negative control; atg-/-) showing specific band of Atg5-Atg12 conjugate at 56 kDa position.
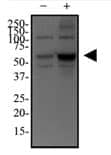
p62/SQSTM1 Antibody [NBP1-48320] HeLa cells were treated with (+) or without (-) 50 uM of Chloroquine for 24 hours and the whole cell lysates were analyzed in WB using anti-p62/SQSMT1 and anti-alpha tubulin (NB100-690; loading control).
Where can I get autophagy inhibitors or inducers?
Here on Bio-techne.com - we have a large range of bioactive small molecules and offers several different inhibitors/inducers of autophagy:
Feature Products
|
Catalog Number |
Product |
Activity |
| 4109 | Chloroquine diphosphate | Antimalarial; inhibits apoptosis and autophagy |
| 4545 | E 64d | Cathepsin inhibitor; interferes with autolysosomal digestion |
| 3977 | 3-Methyladenine | Class III PI 3-kinase inhibitor; also inhibits autophagy |
| NBP2-49888 | Tat-D11 peptide | For the in vitro and in vivo induction of autophagy |
|
View a complete list of autophagy related products. Does Bio-Techne offer any peptides for the induction of autophagy?Yes, we offer Tat-D11 peptide (NBP2-49888) which is useful for the in vitro and in vivo induction of autophagy. Structurally, Tat-D11 is a shorter version of Tat-Beclin 1 which was engineered by Shoji-Kawata et al 2013 as a peptide composed of the autophagy-inducing region of Beclin 1 fused to the HIV-Tat protein. Mechanistically, these peptides induce autophagy through interaction with the negative regulator of autophagy GAPR-1/GLIPR2. Notably, in comparison to Tat-Beclin 1, Tat-D11 increases the induction of autophagosomes and autolysosomes by over five fold. |
||

Fluorescent microscopy analysis of GFP-puncta in HeLa cells expressing GFP-LC3B treated with scrambled peptide Tat-L11S (NBP2-49887) or peptide Tat-D11 (NBP2-49888).
For immunocytochemistry/immunofluorescence (ICC/IF) of LC3, how should I fix my cells? Do I need to permeabilize cells?
In our QC validation testing of LC3 antibodies, we routinely fix various cells in 4% paraformaldehyde/PFA (i.e. 10% buffered formalin) for 10 minutes at room temperature. Yes, permeabilization is a required step because LC3 localizes to the cytosol and membranes of the autophagosomes. In our lab, we use 0.1-0.5% triton X100 for 10 minutes to permeabilize paraformaldehyde fixed cells. Importantly, permeabilization step is not required when fixing the cells in methanol for 5 minutes since methanol itself acts a permeabilizing agent.
Do I need to include an antigen retrieval step while performing IHC-P of LC3?
Antigen retrieval is generally a required step when the tissues are fixed in 4% PFA (i.e. 10% buffered formalin) for more than 4-6 hours. For routine IHC-P methods, fixation time varies from 6-24 hours and over fixation should be avoided as it may lead to excessive crosslinking of the proteins in the fixed tissues. Over fixed tissues will require more rigorous antigen retrieval which can lead to development of false signal. In our lab, we routinely use 10 mM sodium citrate (pH 6.0) buffer based method of heat induced antigen retrieval, wherein we incubate the slides in the buffer at a sub-boiling temperature for 10 minutes followed by cooling of slides (while in retrieval buffer) for 30 minutes at room temperature.
What staining pattern should I expect in IHC-P assay of LC3?
LC3-I is found in the cytosol whereas LC3-II localizes to the autophagosomes, and in IHC-P, a diffused cytoplasmic staining (LC3-I) may be observed with punctate staining (LC3-II) in cells undergoing autophagic death. For reference images on LC3 IHC staining, we suggest checking publications such as Parajuli and MacMillan-Crow 2013, Kang et al. 2013, Guo et al. 2011, Shintaku 2011, and more listed on the Reviews and Publications section of datasheets of our LC3 Antibodies.
I see a diffused staining of LC3 in IHC-P. How do I confirm if it is LC3 and not non-specific background?
Diffuse to punctate pattern of staining should be expected for LC3, and in order to confirm the specificity of immuno-reactivity, we suggest the following controls in IHC-P assay: Negative control (no primary, no secondary), Secondary only negative control (no primary added), and Peptide block control (Peptide Competition Protocol). Depending upon the outcome of the staining in test/control samples, additional measures may be taken by following appropriate troubleshooting suggestions from our Support by Application page.
For LC3 IHC-P staining, is it normal to obtain a signal in the nucleus of the cells?
The majority of research publications suggests that the LC3-I form is cytosolic whereas the LC3-II form localizes to the autophagosomal membranes of cells undergoing autophagic death. There are a few research reports, however, that shows the nuclear localization of LC3. For additional information on localization /the biological relevance of nuclear pool of LC3, we strongly recommend reviewing the following publications – Hasui et al. 2011, Drake et al. 2010, Martinez-Lopezand et al. 2013, and Karim et al. 2007. From the assay point of view, it is helpful to check fixation time since inappropriate/under-fixation may lead to dispersal of LC3 into the cellular nuclei of dissected tissues or cultured cells. Optimizing the permeablization recipes/timing and the concentration or incubation time of primary antibody may also improve localization and sensitivity.
Are there any other resources or guidelines on tips for working with LC3?
Yes, one of the best resources is the recently documented "Guidelines for the use and interpretation of assays for monitoring autophagy (3rd edition)" (Klionsky et al. 2016). We also recommend "How to interpret LC3 immunoblotting" by Mizushima and Yoshimori 2007, and "Autophagy: assays and artifacts" by Barth et al. 2010.
References
- Baisamy L, Cavin S, Jurisch N et al. 2009.The ubiquitin-like protein LC3 regulates the Rho-GEF activity of AKAP-Lbc. J Biol Chem, 284(41):28232-42.
- Barth S, Glick D, Macleod KF. 2010. Autophagy: assays and artifacts. J Pathol, 221(2):117-24.
- Drake KR, Kang M, Kenworthy AK. 2010. Nucleocytoplasmic distribution and dynamics of the autophagosome marker EGFP-LC3. PLoS One. 5(3):e9806
- Guo GF, Jiang WQ, Zhang B et al. 2011. Autophagy-related proteins Beclin-1 and LC3 predict cetuximab efficacy in advanced colorectal cancer. World J Gastroenterol, 17(43):4779-86.
- Hasui K, Wang J, Jia X et al. 2011. Enhanced Autophagy and Reduced Expression of Cathepsin D Are Related to Autophagic Cell Death in Epstein-Barr Virus-Associated Nasal Natural Killer/T-Cell Lymphomas: An Immunohistochemical Analysis of Beclin-1, LC3, Mitochondria (AE-1), and Cathepsin D in Nasopharyngeal Lymphomas. Acta Histochem Cytochem. 44(3):119-31
- Kang R, Loux T, Tang D et al. 2012. The expression of the receptor for advanced glycation endproducts (RAGE) is permissive for early pancreatic neoplasia. Proc Natl Acad Sci U S A, 109(18):7031-6.
- Karim MR, Kanazawa T, Daigaku Y. 2007. Cytosolic LC3 ratio as a sensitive index of macroautophagy in isolated rat hepatocytes and H4-II-E cells. Autophagy. 3(6):553-60.
- Klionsky DJ, Abdelmohsen K, Abe A et al. 2016. Guidelines for the use and interpretation of assays for monitoring autophagy (3rd edition). Autophagy, 12(1):1-222 [PMID 26799652]
- Martinez-Lopez N, Athonvarangkul D, Mishall P et al. Autophagy proteins regulate ERK phosphorylation. Nat Commun. 4:2799.
- Mizushima N, Yoshimori T. 2007. How to interpret LC3 immunoblotting. Autophagy, 3(6):542-5.
- Nymann-Andersen J, Wang H, Olsen RW et al. 2002. Biochemical identification of the binding domain in the GABA (A) receptor-associated protein (GABARAP) mediating dimer formation. Neuropharmacology, 43(4):476-81.
- Parajuli N, MacMillan-Crow LA. 2013. Role of reduced manganese superoxide dismutase in ischemia-reperfusion injury: a possible trigger for autophagy and mitochondrial biogenesis? Am J Physiol Renal Physiol, 304(3):F257-67.
- Shintaku M. 2011. Immunohistochemical localization of autophagosomal membrane-associated protein LC3 in granular cell tumor and schwannoma. Virchows Arch, 459(3):315-9.
- Shoji-Kawata, S., et al., Identification of a candidate therapeutic autophagy-inducing peptide. Nature, 2013. 494(7436): p. 201-6.