Immuno-oncology: The Anti-Tumor Immune Response vs the Anti-Immune Tumor Response
Every time a cell divides, there is potential for introducing mutations that can transform it from healthy to malignant. The immune system is constantly on patrol for these transformed cells, activating an extensive arsenal of anti-tumor immune responses. Innate cells, such as natural killer (NK) cells, NK T cells, and gamma-delta (γδ) T cells are the first line of defence against tumors. Macrophages, dendritic cells (DCs), CD4+ T cells, and CD8+ T cells act as the last line of defence for eliminating malignant cells.
Meanwhile, tumor cells are engaged in an attack of the immune response. Both intracellular and extracellular metabolic changes create a tumor microenvironment (TME) unfavorable to antitumor immune activity. Tumor development and disease progression results from a failure of the immune response to overcome these attacks.
Navigate to specific cell-type markers using the table below.
Antitumor Immune Response
Anti-Immune Tumor Response
- Hypoxia
- Upregulation of inhibitory ligands
- Recruitment, differentiation, expansion of immunosuppressive cells
- T cell exhaustion, NK cell exhaustion
- Extracellular Vesicles
The First Line of Defense: NK cells, NKT cells, and γδ T cells
Cytotoxic cells of the innate immune system are responsible for killing transformed cells expressing danger-associated molecular patterns (DAMPs) and for creating a pro-inflammatory environment by secreting chemokines and cytokines. Cells that are stressed will upregulate DAMPs, which can then be recognized by activating receptors on immune cells. Upon activation, these immune cells can directly kill tumor cells via perforin and granzyme-mediated apoptosis, as well as secrete high levels of interferon-gamma (IFN-γ).
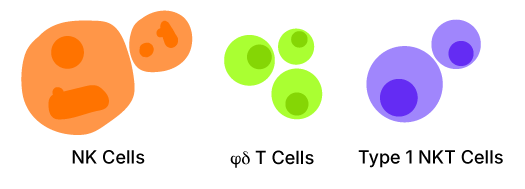
NK cells
NK cells express a combination of activating and inhibitory receptors. The integration of these signals ultimately results in cellular activation and release of cytotoxic molecules.
| Activating Receptor | Ligand | Cellular Expression | |||
|---|---|---|---|---|---|
| Human | Mouse | Human | Mouse | ||
| IgG | NK, NKT, γδ | ||||
| KIR2DS (KIR2DS1, KIR2DS2, KIR2DS3, KIR2DS4, KIR2DS5): DAP12 |
KLRA2/Ly49b, KLRA3/Ly49c | HLA-C, and unknown ligands | H-2Dd, H-2Dk, H-2Dp, H-2Kb | NK, NKT | |
| KIR3DS1 | -- | unknown | -- | NK, NKT | |
| NKG2D: DAP10 | MICA, MICB, ULBP-1, ULBP-2, ULBP-3, ULBP-4, ULBP-5, ULBP-6 | H60, Rae-1 | NK, NKT, γδ | ||
| CD94-NKG2C, NKG2E, NKG2H: DAP12 | HLA-E | H-2Qa1b | NK, NKT | ||
| NKp30 | -- | B7-H6, BAG6, Viral HA | -- | NK, NKT | |
| NKp44:DAP12 | -- | PCNA, Viral HA | -- | NK, NKT | |
| NKp46 | -- | Viral HA | -- | NK, NKT | |
| DNAM-1/CD226 | Nectin-2/CD112, PVR/CD155 | NK, NKT, γδ | |||
Bio-Techne has highly validated antibodies for flow cytometry and immunocytochemistry (ICC) applications to detect NK cell markers in both human and mouse cells.
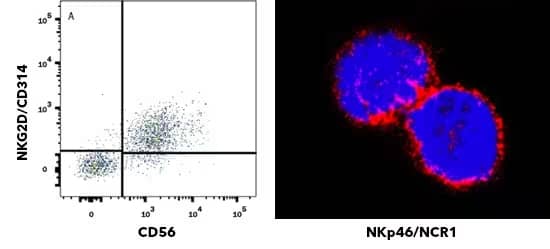
Left: Human peripheral blood mononuclear cells (PBMCs) gated on CD3- cells were stained with APC-conjugated Mouse Anti-Human NCAM-1/CD56 (301040) (Catalog # FAB2408A) and Mouse Anti-Human NKG2D/CD314 (149810) (Catalog # MAB139) followed by anti-Mouse IgG PE-conjugated Monoclonal Antibody (Catalog # F0102B). Clone 149810 was used by HCDM in HLDA workshop to establish CD designation for NKG2D/CD314. Right: NKp46/NCR1 was detected in immersion fixed NK-92 human natural killer lymphoma cell line Mouse Anti-Human NKp46/NCR1 (195314) (Catalog # MAB1850) at 25 µg/mL for 3 hours at room temperature. Cells were stained using the NorthernLights™ 557-conjugated Anti-Mouse IgG Secondary Antibody (red; Catalog # NL007) and counterstained with DAPI (blue). Clone 195314 was used by HCDM in HLDA workshop to establish CD designation for NKp46/CD335.
NKT Cells
NKT cells are activated through recognition of lipid antigens presented to the invariant T cell receptor (iTCR) by CD1d.
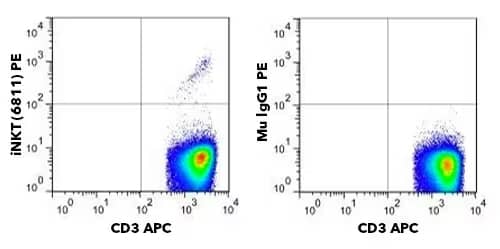
NKT cells are small percentage of CD3+ cells in PBMCs. Human PBMCs were stained with APC-Conjugated Mouse Anti-Human CD3 (OKT3) (Catalog # NBP2-24867APC) and either PE-Conjugated Anti-Human V-alpha-24-J-alpha-18 TCR (6B11) (Catalog # NBP2-00267PE) (left) or matched isotype control (right).
γ/δ T Cells
γ/δ T cells express a T cell receptor (TCR) with a gamma chain and delta chain, but do not recognize peptides presented by MHC molecules. Activation of γδ T cells can occur through engagement of the TCR, or by other activation receptors, such as NKG2D. Human γδ T cells expressing a Vγ9Vδ2 TCR recognize phosphoantigens, such as (E)-4-Hydroxy-3-methyl-but-2-enyl pyrophosphate (HMB-PP) and isopentenyl pyrophosphate (IPP), which are often released by tumor cells. These phosphoantigens bind to CD277/BTN3A1 expressed on the tumor cell and stimulate γδ T cell activation.
Increased prevalence of γδ T cells in mucosal and epithelial tissues, suggest they are strategically positioned for anti-tumor defense. They also present an interesting opportunity for immune cell therapy. One study examining nearly 600 patients with colorectal cancer showed patients with abundant γδ T cells had a higher disease-free 5-year survival rate.
Bio-Techne has a selection of antibodies for general identification of γδ TCR, as well as antibodies to detect specific gamma and delta chains, such as Vγ9 and Vδ2.
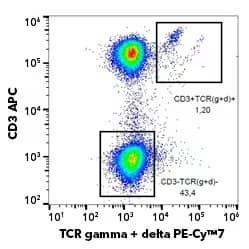
Pseudocolor flow cytometry plot detecting gamma-delta TCR in human PBMCs. Cells were incubated with PE-Cy7TM-Conjugated Anti-Human TCR gamma/delta (B1) (Catalog # NBP2-62225) and APC-Conjugated Anti-Human CD3. Gamma-delta T cells express both CD3 and gamma-delta TCR.
The Last Line of Defense: M1 Macrophages, Dendritic Cells, CD4+ and CD8+ T cells
Activation of NK cells, γδ T cells, and NKT cells generates a pro-inflammatory environment which signals to other cells of the immune system that more help is needed. Under these inflammatory conditions, with high levels of IFN-γ, the phenotype of incoming macrophages is skewed toward a tumoricidal, or M1, phenotype. M1 macrophages are associated with a high level of phagocytosis and secretion of pro-inflammatory cytokines that contribute to tumor cell elimination. In addition to canonical macrophage markers, CD11b, CD11c, CD14 and F4/80 (mice), M1 macrophages have distinct expression of surface markers, intracellular factors, and secreted chemokines and cytokines.
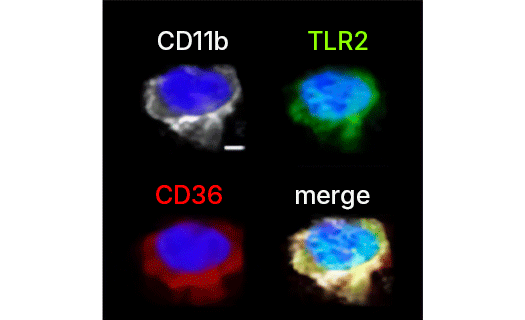
CD36 is highly expressed on the surface of macrophages and co-localizes with CD11b and TLR2. High magnification (3X) confocal imaging shows subretinal CD11b-positive cells (white) with the co-localization of CD36 (red) and TLR2 (green). Scale bar = 5 um. CD36 was detected with Rabbit Anti-Human CD36 (Catalog # NB400-145). Image adapted from Image collected and cropped by CiteAb from the following publication (//www.nature.com/articles/s41598-019-49472-8), licensed under a CC-BY license.
Select M1 Macrophage Markers
| Surface | Intracellular | Secreted |
|---|---|---|
| B7-1/CD80 B7-2/CD86 CD36/SR-B3 CD68/SR-D1 Fc gamma RIII (CD16) HLA-DRHI (human), MHC-IIHI (mouse) IFN-γ receptor I (IFN-γ R1) |
COX-2 iNOS IRF5 STAT1 |
CCL2 (MCP-1) CCL3 (MIP-1α) CCL4 (MIP-1β) CCL5 (RANTES) IL-1β TNF-α IFN-γ CXCL8 (IL-8) IL-12 |
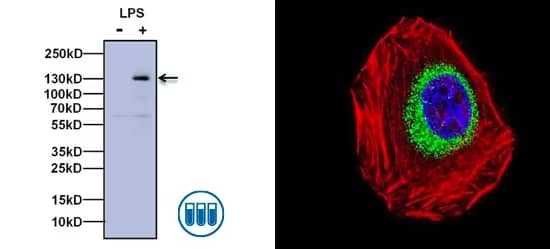
Biological Strategies Validation. (Left) Western blot analysis of iNOS expression in RAW264 cells either untreated (left lane) or stimulated with LPS at 1 ug/mL for 16 hours (right lane). The membrane was probed with Rabbit Anti-iNOS (Catalog # NB300-605) followed by Goat anti-Rabbit IgG (H+L) Secondary Antibody, HRP conjugate. Chemiluminescent detection was performed using SuperSignal West Pico. (Right) ICC/IF analysis of iNOS in A540 cells. Cells were probed with Rabbit Anti-iNOS polyclonal antibody (green, Catalog # NB300-605) and incubated with a DyLight 488 conjugated secondary antibody, F-Actin staining with Phalloidin (red) and nuclei with DAPI (blue) is shown.
Dendritic Cells
Dendritic cells (DCs) are the final bridge between the innate and adaptive immune system. DCs present tumor antigens to naïve CD4+ and CD8+ T cells in the tumor draining lymph nodes and initiate T cell activation. The pro-inflammatory environment created by the NK cells, NKT cells, M1 macrophages, and γδ T cells, results in priming of Th1 helper CD4+ cells and cytotoxic CD8+ T cells.
Immune profiling of tumor infiltrating lymphocytes can provide important information about disease prognosis and potential response to immunotherapy. In addition to a wide selection of highly validated antibodies for flow cytometry, Bio-Techne offers Th1 flow cytometry kits for identification of human and mouse Th1 cells.
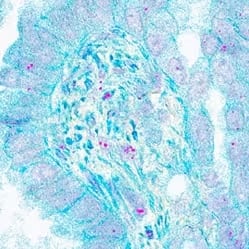
In situ detection of CD4+ Th1 cells in human lung cancer using Dual RNAscope in situ hybridization (ISH)/Immunohistochemistry (IHC). CCR5 mRNA (red) and CD4 protein (green) were detected in formalin-fixed paraffin-embedded tissue sections of human lung cancer. Our Integrated Co-Detection Workflow was performed using Rabbit Anti-Human CD4 (Catalog # NBP1-19371) at 1:100 dilution and RNAScope Probe Hs-CCR5 ( Catalog # 601508). Tissue was stained on Leica Bond RX using RNAscope® 2.5 LS Reagent Kit-RED (Catalog # 322150), BOND Polymer Refine Detection (DAB) and Hematoxylin, BOND Polymer Refine Red Detection and Hematoxylin, and RNAscope® 2.5 LS Green Accessory Pack ( Catalog # 322550). Tissue was counterstained with 50% Hematoxylin (blue).
Select Markers for CD4+ Th1 and Cytotoxic CD8+ T Cells
| Th1 CD4+ T cells | Cytotoxic CD8+ T cell | |
|---|---|---|
| Surface Markers | CD3, TCRα, TCRβ, TCRα/β | |
| CD4, CCR5, CXCR3, CCR1, IFN-γ R1/CD119, IFN-γ R2, IL-12R-β1, IL-12R-β2 |
CD8, Integrin-αL/CD11a, CXCR3, FASL/TNFSF6, CD107a/Lamp-1 | |
| Intracellular Markers | STAT1, STAT4, T-bet/TBX21 | T-bet/TBX21, Eomes |
| Cytokines | IFN-γ, IL-2, TNF-α | TNF-α, Lymphotoxin-α/TNF-β, IFN-γ |
| Antitumor Activity | Secretion of IFN-γ and TNF-α | Secretion of IFN-γ, TNFα, Perforin, Granzyme A, and Granzyme B FAS:FAS-L-induced cell death |
Despite the combined antitumor activities of these cells, some tumor cells can escape this elimination process over time, leading to tumor growth and disease progression.
Immunosuppression and Tumor Escape: Going on the Offensive
Tumor cells consistently try to outsmart and outlast the anti-tumor immune response by creating a microenvironment that is hostile to immune cells. The TME consists of multiple different cell types including fibroblasts, endothelial cells, and infiltrating immune cells, whose functions can be exploited or altered to create conditions that are favorable for tumor progression. In addition to hypoxia, the anti-immune tumor response includes differentiation and recruitment of immunosuppressive cells, induction of T cell and NK cell exhaustion, and expression of inhibitory molecules, like PD-L1, HLA-G, and CD47. Many of the molecules implicated in the immunosuppressive mechanisms detailed here are currently being investigated as targets for cancer immunotherapy.
Hypoxia in the TME
Hypoxia is a critical factor to promote immunosuppression in the TME. Commonly measured by HIF-1α expression, tumor hypoxia results from the combined effects of increased cellular proliferation and decreased or sub-optimal blood supply. Episodic or acute hypoxic events are typical in tumors, due to temporary obstruction of blood flow which may limit oxygen supply for short periods of time (minutes to hours). In contrast, as tumors grow, cells are exposed to extended or chronic hypoxia (hours to days), due to abnormal and insufficient vascularization that limits the diffusion of oxygen to some tumor-regions.
Hypoxic tumor cells produce high levels of CCL28, which attracts CXCL10-expressing Tregs. Additionally, HIF-1alpha has been shown to strongly increase the expression of the master Treg transcription factor forkhead box 3P (FoxP3).
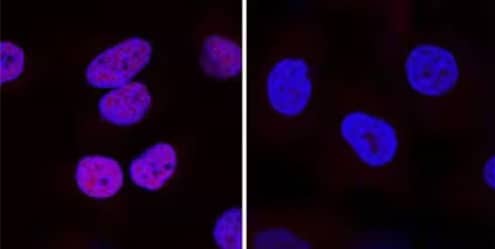
Genetic Strategies Validation. HIF-1 alpha was detected in immersion fixed DFO-treated HeLa cells (left) but was not detected in HIF-1 alpha knockout HeLa cells (right) using Knockout Validated Mouse Anti-Human HIF-1 alpha (H1alpha67) (Catalog # NB100-105) at 25 μg/mL for 3 hours at room temperature. Cells were stained using a NorthernLightsTM 557-conjugated Donkey Anti-Mouse IgG Secondary Antibody (red; Catalog # NL007) and counterstained with DAPI (blue). NB100-105 has also been validated by Biological Strategies.
Recruitment and Differentiation of Immunosuppressive Cells in the TME
To create this immunosuppressive environment, tumor cells undergo significant transcriptional and metabolic changes including:
- Increased glucose uptake
- Excess lactate production, leading to low pH in TME
- Increased amino acid uptake
- Increased production of reactive oxygen species (ROS) and reactive nitrogen species (RNS)
- Production of prostaglandin E2 (PGE2)
These changes in the TME promote differentiation, recruitment, and expansion of immunosuppressive cells such as tumor associated macrophages (TAMs), myeloid derived suppressor cells (MDSCs), and T regulatory cells (Tregs).
Tumor Associated Macrophages (TAMs)
TAMs, sometimes referred to as M2 macrophages, differentiate from monocytes in the presence of immunosuppressive cytokines. Unlike their pro-inflammatory M1 counterparts, M2 macrophages are more likely to express inhibitory ligands like PD-L1, TRAIL, and FASL/TNF6SF and secrete anti-inflammatory cytokines, such as IL-10 and TGF-β. These cytokines are critical mediators of Treg expansion, further M2 polarization, and inhibit NK cell and CD8 T cell activation. TAMs also directly inhibit NK cell cytotoxicity by expressing non-classical MHC I molecules HLA-E and HLA-G.
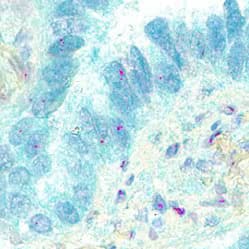
Co-detection of PD-1 and PD-L1 in human lung cancer by Dual RNAScope ISH/IHC. PDCD1 (PD-1) mRNA (red) and PD-L1 protein (green) were detected in formalin-fixed paraffin-embedded tissue sections of human lung cancer. The Integrated Co-Detection Workflow was performed using Rabbit Anti-Human PD-L1 (Catalog # NBP1-76769) at 1:100 dilution and RNAScope Probe Hs-PDCD1 (Catalog # 602028) and. Tissue was stained on Leica Bond RX using RNAscope® 2.5 LS Reagent Kit-RED (Catalog # 322150), BOND Polymer Refine Detection (DAB) and Hematoxylin, BOND Polymer Refine Red Detection and Hematoxylin and RNAscope® 2.5 LS Green Accessory Pack (Catalog #322550). Tissue was counterstained with 50% Hematoxylin (blue).
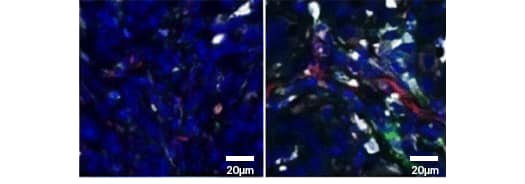
Biological Strategies Validation. Ionizing radiation (IR) increases the presence of tumor associated macrophages (TAMs). Immunohistochemistry analysis. Left: no IR; Right: IR. Tissue was stained with Rabbit-Anti-Arginase 1/Arg1 (white, Catalog # NBP1-32731), Goat-Anti-CD31/PECAM (red, Catalog # AF3628), and F4/80 (green). NBP1-32731 has been validated by genetic strategies by siRNA-mediated knockdown.
Image adapted from Choi SH, Kim AR, Nam JK, et al. Tumour-vasculature development via endothelial-to-mesenchymal transition after radiotherapy controls CD44v6+ cancer cell and macrophage polarization. Nat Commun. 2018;9(1):5108. Published 2018 Nov 30. doi:10.1038/s41467-018-07470-w. Licensed under CC-BY.
Myeloid-Derived Suppressor Cells (MDSCs)
Similar to TAMs, MDSCs are immunosuppressive myeloid cells commonly found in the TME. There are two subsets of MDSCs derived from either a neutrophil (PMN-MDSCs) or a monocyte (M-MDSCs) precursor, with M-MDSCs able to further differentiate into TAMs. In addition to secreting immunosuppressive cytokines, MDSCs pay an active role in altering nutrients and metabolites in the TME. They have elevated expression of metabolic enzymes like iNOS, Arginase 1 (Arg1), and IDO leading to increased reactive oxygen species (ROS), and a decrease in amino acids arginine and tryptophan.
Bio-Techne offers highly validated antibodies to detect and monitor MDSC function for a range of applications including IHC and blocking/neutralization.
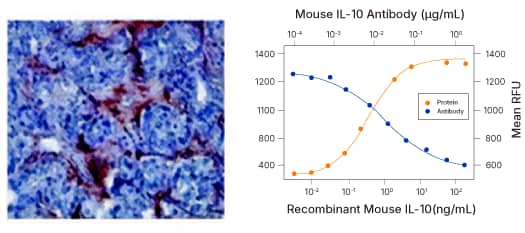
(Left) IHC: MMP-9 was detected in human prostate cancer with Rabbit Anti-MMP-9 Antibody (Catalog # NBP1-57940) and detected using HRP/AEC red color stain. (Right) Blocking/Neutralization: Recombinant Mouse IL-10 (Catalog # 417-ML) stimulates proliferation in the MC/9 2 mouse mast cell line in a dose-dependent manner (orange line). Proliferation elicited by Recombinant Mouse IL 10 (2.5 ng/mL) is neutralized (green line) by increasing concentrations of Rat Anti-Mouse IL 10 (JES052A5) (Catalog # MAB417).
Selected MDSC Markers
| Activating Receptor | Surface | Secreted | |
|---|---|---|---|
| Human | Mouse | IL-10 MMP-9 TGF-β 1 VEGF |
|
| PMN-MDSCs | CD11b | ||
| CD15 VEGFR1 CD33/Siglec-3 CD66b/CEAM-8 |
2B4/CD244/SLAMF4 Ly6Clow Ly6Ghigh | ||
| M-MDSC | CD11b | ||
| CD14 CD33/Siglec-3 CD15(-) CD66b/CEAM-8 (-) |
CCR2 CD49d/Integrin-alpha 4 Ly6Chigh Ly6Glow | ||
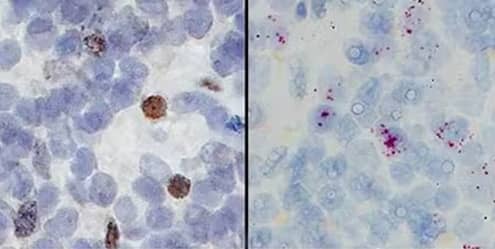
Orthogonal strategies validation using Dual RNAscope ISH/IHC. Formalin-fixed paraffin-embedded tissue sections of human lymph node were stained for immunohistochemistry (left) using Rabbit Anti-CD11b Antibody (Catalog # NB110-89474) at 1:50 dilution with 1 hour incubation at room temperature followed by incubation with Anti-Rabbit IgG VisUCyte HRP Polymer Antibody (Catalog # VC003) and processed for and DAB chromogen (yellow-brown). Adjacent tissue section (right) probed for CD11b mRNA ( RNAScope Probe, Catalog #555098; Fast Red chromogen, Catalog # 322750). Tissue was counterstained with Hematoxylin (blue). Specific staining was localized to lymphocytes.
Regulatory T cells (Tregs)
Tregs are a critical subset of CD4+ T cells that regulate the immune response and prevent autoimmunity. They suppress both Th1 and CD8+ cytotoxic T cells by inducing apoptosis, increasing extracellular adenosine, and inhibiting DC maturation. With increased lactate and hypoxia, the TME is a rich environment for Treg expansion and accumulation. In addition to highly validated antibodies for individual Treg markers, Bio-Techne offers Treg flow cytometry kits to reproducibly identify Tregs in human, mouse, and rat cells.
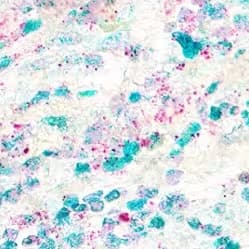
In situ detection of CD4+ T regulatory cells in human breast cancer. Dual RNAscope ISH-IHC staining in formalin-fixed paraffin-embedded tissue sections of human breast cancer for CD4 mRNA (red) and FOXP3 protein (green). The Integrated Co-Detection Workflow was performed using RNAScope Probe Hs-CD4 (Catalog # 605608) and Rabbit Anti-Human FOXP3 (Catalog # NB600-245) at 1:200 dilution. Tissue was stained on Leica Bond RX using RNAscope® 2.5 LS Reagent Kit-RED (catalog # 322150), BOND Polymer Refine Detection (DAB) and Hematoxylin, BOND Polymer Refine Red Detection and Hematoxylin from Leica Biosystems and RNAscope® 2.5 LS Green Accessory Pack (Catalog # 322550). Tissue was counterstained with 50% Hematoxylin (blue).
Selected Treg Markers
| Surface | Intracellular | Secreted |
|---|---|---|
| 5’ Nucleotidase/CD73 CD25/IL-2R alpha CD127/IL7R alphalow CTLA-4 LAP (TGF-beta 1) Neuropilin-1 |
FOXP3 Helios (+/-) STAT5A, STAT5B |
Galectin-1 IL-10 IL-35 TGF-β 1 |
Cytotoxic T Cell and NK Cell Exhaustion
Cytolytic T cell exhaustion is a hallmark of chronic viral infection and tumor progression. Both CD8+ T cells and NK cells are prone to exhaustion in the TME. CD8+ T cell exhaustion is traditionally understood to be a result of chronic exposure to antigen and sustained signaling through TCR. NK cell exhaustion is also the result of persistent proliferation, decreased signaling from activating receptors and the immunosuppressive environment of the TME. Both are characterized by decreased effector cytokine production, reduced expansion, and upregulation of inhibitory receptors.
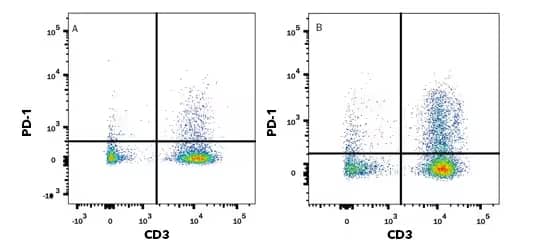
Flow cytometry. Human peripheral blood mononuclear cells (PBMCs) either (A) untreated or (B) treated with 5 μg/mL PHA overnight were stained with Goat Anti-Human PD 1 (Catalog # AF1086) followed by Phycoerythrin-conjugated Anti-Goat IgG Secondary Antibody (Catalog # F0107) and APC conjugated Mouse Anti-Human CD3 epsilon (UCHT1) (Catalog # FAB100A). Quadrant markers were set based on control antibody staining (Catalog # F0107). Clone UCHT1 was used by HCDM in HLDA workshop to establish CD designation for CD3.
Selected Immune Cell Exhaustion Markers
| T Cell Exhaustion Markers | NK Cell Exhaustion Markers |
|---|---|
| PD-1, CTLA-4, LAG-3, 2B4/CD244/SLAMF4, TIM-3, TIGIT, BTLA/CD272, CD160 |
NKG2A, PD-1, TIM-3, TIGIT, 2B4/CD244/SLAMF4 |
Tumor-derived Extracellular Vesicles
Extracellular vesicles (EVs) are critical mediators of intercellular communication under both physiological and pathological conditions. Small EVs, or exosomes, are implicated in many aspects of cancer progression including tumor growth and metastasis and angiogenesis. Specifically within the TME, small EV-mediated immunosuppressive strategies include inhibiting cytotoxicity of T cells and NK cells, expanding MDSCs and Tregs, as well as inhibition of DC maturation. Due to expression of ligands such as PD-L1, Her-2, and CD20 on the vesicle surface, tumor EVs can serve as decoy targets for immunotherapy, limiting therapeutic efficacy.
Related Research Areas
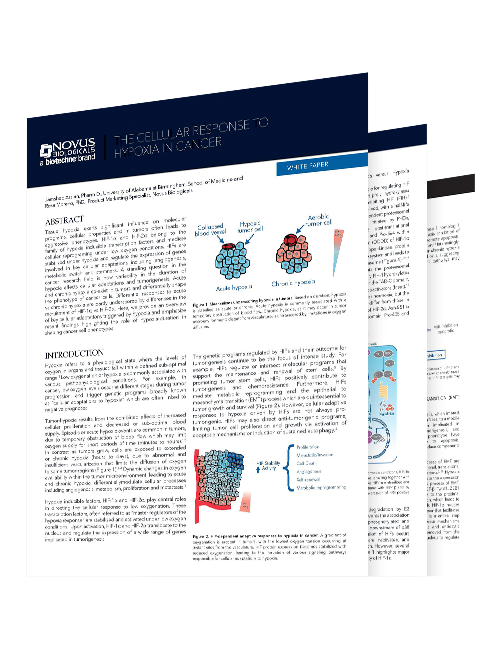
Hypoxia in Cancer Whitepaper
Hypoxia in Cancer Whitepaper
This white paper provides an overview of hypoxia in cancer. The key role of HIF transcription factors as master regulators of hypoxia adaptations in cancer and recent findings on the differential responses elicited by acute vs chronic hypoxia are highlighted.
Biomarker Discovery and Diagnostics for Oncology
Biomarker Discovery and Diagnostics for Oncology
Exosomes play critical roles in various disease processes including stimulating tumor cell growth and immune suppression. In this webinar, the use of exosomes for monitoring cancer immunotherapy response and the need for standardized and reproducible assays for biomarker development are discussed.
Immuno-oncology Research Brochure
Immuno-oncology Research Brochure
Discover new biomarkers, how to characterize immune cells and drive the development of novel checkpoint therapeutics using tools and services which allow for simplified workflows delivering consistent results.
Kabelitz D. CD277 takes the lead in human γδ T-cell activation. Blood 2012;120:2159–61. https://doi.org/10.1182/BLOOD-2012-07-442731.
Pistoia V, Tumino N, Vacca P, Veneziani I, Moretta A, Locatelli F, et al. Human γδ T-Cells: From Surface Receptors to the Therapy of High-Risk Leukemias. Front Immunol 2018;0:984. https://doi.org/10.3389/FIMMU.2018.00984.
Presti E Lo, Pizzolato G, Corsale AM, Caccamo N, Sireci G, Dieli F, et al. γδ T Cells and Tumor Microenvironment: From Immunosurveillance to Tumor Evasion. Front Immunol 2018;9:1. https://doi.org/10.3389/FIMMU.2018.01395.
Gamma Delta (γδ) T Cells | British Society for Immunology. n.d. URL: https://www.immunology.org/public-information/bitesized-immunology/cell… (Accessed 6 October 2021).
Pende D, Falco M, Vitale M, Cantoni C, Vitale C, Munari E, et al. Killer Ig-Like Receptors (KIRs): Their Role in NK Cell Modulation and Developments Leading to Their Clinical Exploitation. Front Immunol 2019;0:1179. https://doi.org/10.3389/FIMMU.2019.01179.
O’Keeffe J, Podbielska M, Hogan EL. Invariant natural killer T cells and their ligands: focus on multiple sclerosis. Immunology 2015;145:468. https://doi.org/10.1111/IMM.12481.
Zhang W, Huang Q, Xiao W, Zhao Y, Pi J, Xu H, et al. Advances in Anti-Tumor Treatments Targeting the CD47/SIRPα Axis. Front Immunol 2020;0:18. https://doi.org/10.3389/FIMMU.2020.00018.
Wei Y, Ren X, Galbo PM, Moerdler S, Wang H, Alejandro Sica R, et al. KIR3DL3-HHLA2 is a human immunosuppressive pathway and a therapeutic target. Sci Immunol 2021;6:. https://doi.org/10.1126/SCIIMMUNOL.ABF9792.
Bhatt RS, Berjis A, Konge JC, Mahoney KM, Klee AN, Freeman SS, et al. KIR3DL3 Is an Inhibitory Receptor for HHLA2 that Mediates an Alternative Immunoinhibitory Pathway to PD1. Cancer Immunol Res 2021;9:156–69. https://doi.org/10.1158/2326-6066.CIR-20-0315.
Jiang Y, Li Y, Zhu B. T-cell exhaustion in the tumor microenvironment. Cell Death Dis 2015 66 2015;6:e1792–e1792. https://doi.org/10.1038/cddis.2015.162.
Facciabene A, Peng X, Hagemann IS, Balint K, Barchetti A, Wang L-P, et al. Tumour hypoxia promotes tolerance and angiogenesis via CCL28 and Treg cells. Nat 2011 4757355 2011;475:226–30. https://doi.org/10.1038/nature10169.

